
Advertisement
Brightcom Group Limited's (NSE:BCG) Stock Is Going Strong: Is the Market Following Fundamentals?

Brightcom Group's (NSE:BCG) stock is up by a considerable 24% over the past month. Given the company's impressive performance, we decided to study its financial indicators more closely as a company's financial health over the long-term usually dictates market outcomes. Particularly, we will be paying attention to Brightcom Group's ROE today.
Return on equity or ROE is an important factor to be considered by a shareholder because it tells them how effectively their capital is being reinvested. In other words, it is a profitability ratio which measures the rate of return on the capital provided by the company's shareholders.
See our latest analysis for Brightcom Group
How Do You Calculate Return On Equity?
Return on equity can be calculated by using the formula:
Return on Equity = Net Profit (from continuing operations) ÷ Shareholders' Equity
So, based on the above formula, the ROE for Brightcom Group is:
21% = ₹8.3b ÷ ₹39b (Based on the trailing twelve months to December 2021).
The 'return' is the profit over the last twelve months. That means that for every ₹1 worth of shareholders' equity, the company generated ₹0.21 in profit.
What Has ROE Got To Do With Earnings Growth?
So far, we've learned that ROE is a measure of a company's profitability. Based on how much of its profits the company chooses to reinvest or "retain", we are then able to evaluate a company's future ability to generate profits. Assuming everything else remains unchanged, the higher the ROE and profit retention, the higher the growth rate of a company compared to companies that don't necessarily bear these characteristics.
A Side By Side comparison of Brightcom Group's Earnings Growth And 21% ROE
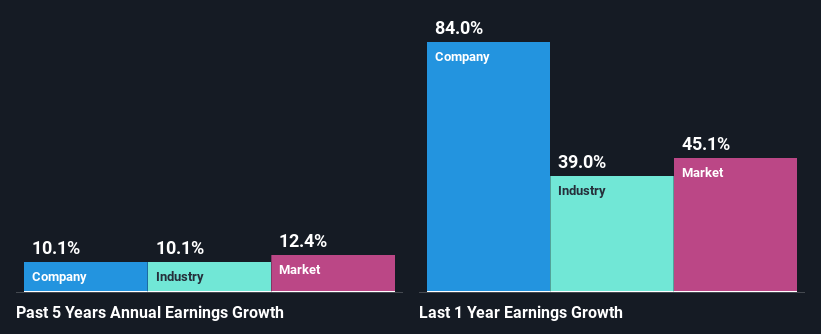
At first glance, Brightcom Group seems to have a decent ROE. Further, the company's ROE is similar to the industry average of 18%. This certainly adds some context to Brightcom Group's moderate 10% net income growth seen over the past five years.
As a next step, we compared Brightcom Group's net income growth with the industry and found that the company has a similar growth figure when compared with the industry average growth rate of 10% in the same period.
The basis for attaching value to a company is, to a great extent, tied to its earnings growth. What investors need to determine next is if the expected earnings growth, or the lack of it, is already built into the share price. By doing so, they will have an idea if the stock is headed into clear blue waters or if swampy waters await. One good indicator of expected earnings growth is the P/E ratio which determines the price the market is willing to pay for a stock based on its earnings prospects. So, you may want to check if Brightcom Group is trading on a high P/E or a low P/E, relative to its industry.
Is Brightcom Group Efficiently Re-investing Its Profits?
In Brightcom Group's case, its respectable earnings growth can probably be explained by its low three-year median payout ratio of 1.1% (or a retention ratio of 99%), which suggests that the company is investing most of its profits to grow its business.
Moreover, Brightcom Group is determined to keep sharing its profits with shareholders which we infer from its long history of paying a dividend for at least ten years.
Summary
In total, we are pretty happy with Brightcom Group's performance. In particular, it's great to see that the company is investing heavily into its business and along with a high rate of return, that has resulted in a sizeable growth in its earnings. If the company continues to grow its earnings the way it has, that could have a positive impact on its share price given how earnings per share influence long-term share prices. Not to forget, share price outcomes are also dependent on the potential risks a company may face. So it is important for investors to be aware of the risks involved in the business. To know the 2 risks we have identified for Brightcom Group visit our risks dashboard for free.
Valuation is complex, but we're here to simplify it.
Discover if Brightcom Group might be undervalued or overvalued with our detailed analysis, featuring fair value estimates, potential risks, dividends, insider trades, and its financial condition.
Access Free AnalysisHave feedback on this article? Concerned about the content? Get in touch with us directly. Alternatively, email editorial-team (at) simplywallst.com.
This article by Simply Wall St is general in nature. We provide commentary based on historical data and analyst forecasts only using an unbiased methodology and our articles are not intended to be financial advice. It does not constitute a recommendation to buy or sell any stock, and does not take account of your objectives, or your financial situation. We aim to bring you long-term focused analysis driven by fundamental data. Note that our analysis may not factor in the latest price-sensitive company announcements or qualitative material. Simply Wall St has no position in any stocks mentioned.
About NSEI:BCG
Brightcom Group
Provides digital marketing solutions to businesses, agencies, and online publishers worldwide.
Flawless balance sheet and slightly overvalued.
Market Insights

Advertisement
Community Narratives
Scaling up in building materials with smart M&A and growing profitability
Fair Value US$2.77|30.0% undervalued
CM
Community Contributor
Hims: The Platform Powering Personalised Healthcare
Fair Value US$114.01|51.9% undervalued
BL
Community Contributor
Undervalued lottery company with strong fundamentals
Fair Value AU$15.00|34.5% undervalued
RO
Community Contributor
Proximus, transferring money from the impatient to the patient investor
Fair Value €16.62|55.1% undervalued
AX
Community Contributor