Affle (India) Limited's (NSE:AFFLE) Stock's On An Uptrend: Are Strong Financials Guiding The Market?


Most readers would already be aware that Affle (India)'s (NSE:AFFLE) stock increased significantly by 25% over the past three months. Since the market usually pay for a company’s long-term fundamentals, we decided to study the company’s key performance indicators to see if they could be influencing the market. In this article, we decided to focus on Affle (India)'s ROE.
Return on equity or ROE is an important factor to be considered by a shareholder because it tells them how effectively their capital is being reinvested. Simply put, it is used to assess the profitability of a company in relation to its equity capital.
View our latest analysis for Affle (India)
How Do You Calculate Return On Equity?
The formula for return on equity is:
Return on Equity = Net Profit (from continuing operations) ÷ Shareholders' Equity
So, based on the above formula, the ROE for Affle (India) is:
13% = ₹3.2b ÷ ₹25b (Based on the trailing twelve months to June 2024).
The 'return' is the amount earned after tax over the last twelve months. Another way to think of that is that for every ₹1 worth of equity, the company was able to earn ₹0.13 in profit.
What Is The Relationship Between ROE And Earnings Growth?
We have already established that ROE serves as an efficient profit-generating gauge for a company's future earnings. We now need to evaluate how much profit the company reinvests or "retains" for future growth which then gives us an idea about the growth potential of the company. Assuming all else is equal, companies that have both a higher return on equity and higher profit retention are usually the ones that have a higher growth rate when compared to companies that don't have the same features.
A Side By Side comparison of Affle (India)'s Earnings Growth And 13% ROE
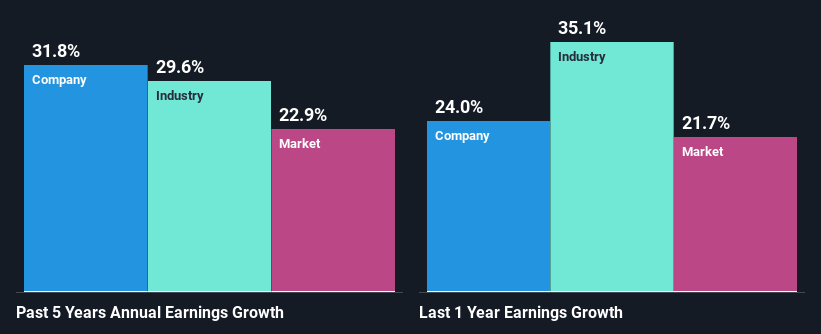
On the face of it, Affle (India)'s ROE is not much to talk about. However, the fact that the its ROE is quite higher to the industry average of 9.3% doesn't go unnoticed by us. Even more so after seeing Affle (India)'s exceptional 32% net income growth over the past five years. That being said, the company does have a slightly low ROE to begin with, just that it is higher than the industry average. Hence, there might be some other aspects that are causing earnings to grow. Such as- high earnings retention or the company belonging to a high growth industry.
As a next step, we compared Affle (India)'s net income growth with the industry and found that the company has a similar growth figure when compared with the industry average growth rate of 30% in the same period.
The basis for attaching value to a company is, to a great extent, tied to its earnings growth. What investors need to determine next is if the expected earnings growth, or the lack of it, is already built into the share price. Doing so will help them establish if the stock's future looks promising or ominous. One good indicator of expected earnings growth is the P/E ratio which determines the price the market is willing to pay for a stock based on its earnings prospects. So, you may want to check if Affle (India) is trading on a high P/E or a low P/E, relative to its industry.
Is Affle (India) Making Efficient Use Of Its Profits?
Affle (India) doesn't pay any regular dividends currently which essentially means that it has been reinvesting all of its profits into the business. This definitely contributes to the high earnings growth number that we discussed above.
Conclusion
On the whole, we feel that Affle (India)'s performance has been quite good. Particularly, we like that the company is reinvesting heavily into its business at a moderate rate of return. Unsurprisingly, this has led to an impressive earnings growth. Having said that, the company's earnings growth is expected to slow down, as forecasted in the current analyst estimates. To know more about the latest analysts predictions for the company, check out this visualization of analyst forecasts for the company.
New: Manage All Your Stock Portfolios in One Place
We've created the ultimate portfolio companion for stock investors, and it's free.
• Connect an unlimited number of Portfolios and see your total in one currency
• Be alerted to new Warning Signs or Risks via email or mobile
• Track the Fair Value of your stocks
Have feedback on this article? Concerned about the content? Get in touch with us directly. Alternatively, email editorial-team (at) simplywallst.com.
This article by Simply Wall St is general in nature. We provide commentary based on historical data and analyst forecasts only using an unbiased methodology and our articles are not intended to be financial advice. It does not constitute a recommendation to buy or sell any stock, and does not take account of your objectives, or your financial situation. We aim to bring you long-term focused analysis driven by fundamental data. Note that our analysis may not factor in the latest price-sensitive company announcements or qualitative material. Simply Wall St has no position in any stocks mentioned.
About NSEI:AFFLE
Affle (India)
Provides mobile advertisement services through information technology and software development services for mobiles in India and internationally.
Flawless balance sheet with reasonable growth potential.
