
Advertisement
- India
- /
- Metals and Mining
- /
- NSEI:SURYAROSNI
Surya Roshni Limited's (NSE:SURYAROSNI) Subdued P/E Might Signal An Opportunity
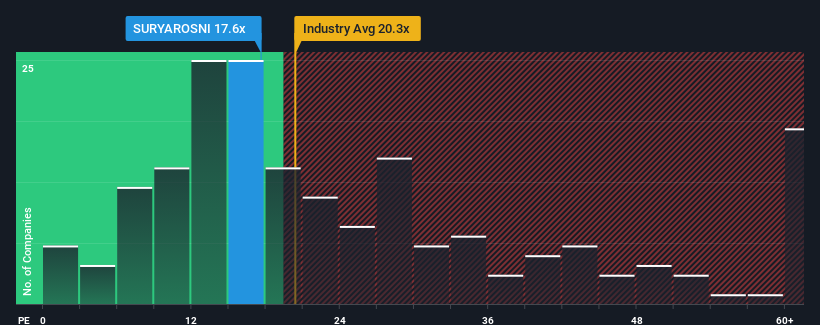
Surya Roshni Limited's (NSE:SURYAROSNI) price-to-earnings (or "P/E") ratio of 17.6x might make it look like a buy right now compared to the market in India, where around half of the companies have P/E ratios above 27x and even P/E's above 51x are quite common. Nonetheless, we'd need to dig a little deeper to determine if there is a rational basis for the reduced P/E.
We check all companies for important risks. See what we found for Surya Roshni in our free report.Surya Roshni hasn't been tracking well recently as its declining earnings compare poorly to other companies, which have seen some growth on average. It seems that many are expecting the dour earnings performance to persist, which has repressed the P/E. If this is the case, then existing shareholders will probably struggle to get excited about the future direction of the share price.
Check out our latest analysis for Surya Roshni
Is There Any Growth For Surya Roshni?
There's an inherent assumption that a company should underperform the market for P/E ratios like Surya Roshni's to be considered reasonable.
Taking a look back first, the company's earnings per share growth last year wasn't something to get excited about as it posted a disappointing decline of 17%. Even so, admirably EPS has lifted 75% in aggregate from three years ago, notwithstanding the last 12 months. So we can start by confirming that the company has generally done a very good job of growing earnings over that time, even though it had some hiccups along the way.
Turning to the outlook, the next year should generate growth of 32% as estimated by the only analyst watching the company. Meanwhile, the rest of the market is forecast to only expand by 25%, which is noticeably less attractive.
In light of this, it's peculiar that Surya Roshni's P/E sits below the majority of other companies. Apparently some shareholders are doubtful of the forecasts and have been accepting significantly lower selling prices.
What We Can Learn From Surya Roshni's P/E?
We'd say the price-to-earnings ratio's power isn't primarily as a valuation instrument but rather to gauge current investor sentiment and future expectations.
Our examination of Surya Roshni's analyst forecasts revealed that its superior earnings outlook isn't contributing to its P/E anywhere near as much as we would have predicted. When we see a strong earnings outlook with faster-than-market growth, we assume potential risks are what might be placing significant pressure on the P/E ratio. At least price risks look to be very low, but investors seem to think future earnings could see a lot of volatility.
The company's balance sheet is another key area for risk analysis. You can assess many of the main risks through our free balance sheet analysis for Surya Roshni with six simple checks.
Of course, you might also be able to find a better stock than Surya Roshni. So you may wish to see this free collection of other companies that have reasonable P/E ratios and have grown earnings strongly.
New: Manage All Your Stock Portfolios in One Place
We've created the ultimate portfolio companion for stock investors, and it's free.
• Connect an unlimited number of Portfolios and see your total in one currency
• Be alerted to new Warning Signs or Risks via email or mobile
• Track the Fair Value of your stocks
Have feedback on this article? Concerned about the content? Get in touch with us directly. Alternatively, email editorial-team (at) simplywallst.com.
This article by Simply Wall St is general in nature. We provide commentary based on historical data and analyst forecasts only using an unbiased methodology and our articles are not intended to be financial advice. It does not constitute a recommendation to buy or sell any stock, and does not take account of your objectives, or your financial situation. We aim to bring you long-term focused analysis driven by fundamental data. Note that our analysis may not factor in the latest price-sensitive company announcements or qualitative material. Simply Wall St has no position in any stocks mentioned.
About NSEI:SURYAROSNI
Surya Roshni
Manufactures and sells steel pipes and strips, and lighting and consumer durables in India.
Flawless balance sheet 6 star dividend payer.
Similar Companies
Market Insights

Advertisement
Weekly Picks
RO


RockeTeller on Santacruz Silver Mining ·
Crazy Undervalued 42 Baggers Silver Play (Active & Running Mine)
Fair Value:CA$8696.7% undervalued
11 followersusers have followed this narrative
5 commentsusers have commented on this narrative
1 likeusers have liked this narrative
RO


Robbo on Fiducian Group ·
Fiducian: Compliance Clouds or Value Opportunity?
Fair Value:AU$126.3% undervalued
1 followerusers have followed this narrative
0 commentsusers have commented on this narrative
0 likesusers have liked this narrative
WO

woodworthfund on Willamette Valley Vineyards ·
Willamette Valley Vineyards (WVVI): Not-So-Great Value
Fair Value:US$242.5% overvalued
2 followersusers have followed this narrative
0 commentsusers have commented on this narrative
1 likeusers have liked this narrative
Recently Updated Narratives
YE
Yellow_fever on China Starch Holdings ·
China Starch Holdings eyes a revenue growth of 4.66% with a 5-year strategic plan
Fair Value:HK$0.562.8% undervalued
1 followerusers have followed this narrative
0 commentsusers have commented on this narrative
0 likesusers have liked this narrative
CO

composite32 on Power Solutions International ·
PSIX The timing of insider sales is a serious question mark
Fair Value:US$37.3845.7% overvalued
1 followerusers have followed this narrative
0 commentsusers have commented on this narrative
0 likesusers have liked this narrative
TA


Talos on Marvell Technology ·
The Great Strategy Swap – Selling "Old Auto" to Buy "Future Light"
Fair Value:US$155.3740.2% undervalued
1 followerusers have followed this narrative
0 commentsusers have commented on this narrative
0 likesusers have liked this narrative
Popular Narratives
TH


TheWallstreetKing on MicroVision ·
MicroVision will explode future revenue by 380.37% with a vision towards success
Fair Value:US$6098.6% undervalued
112 followersusers have followed this narrative
11 commentsusers have commented on this narrative
22 likesusers have liked this narrative
AN


AnalystConsensusTarget on NVIDIA ·
NVDA: Expanding AI Demand Will Drive Major Data Center Investments Through 2026
Fair Value:US$250.3927.6% undervalued
947 followersusers have followed this narrative
6 commentsusers have commented on this narrative
24 likesusers have liked this narrative
OS


oscargarcia on Alphabet ·
The company that turned a verb into a global necessity and basically runs the modern internet, digital ads, smartphones, maps, and AI.
Fair Value:US$3407.2% undervalued
148 followersusers have followed this narrative
6 commentsusers have commented on this narrative
18 likesusers have liked this narrative
