
Advertisement
- India
- /
- Metals and Mining
- /
- NSEI:SURANI
Some Surani Steel Tubes Limited (NSE:SURANI) Shareholders Look For Exit As Shares Take 26% Pounding

To the annoyance of some shareholders, Surani Steel Tubes Limited (NSE:SURANI) shares are down a considerable 26% in the last month, which continues a horrid run for the company. Still, a bad month hasn't completely ruined the past year with the stock gaining 26%, which is great even in a bull market.
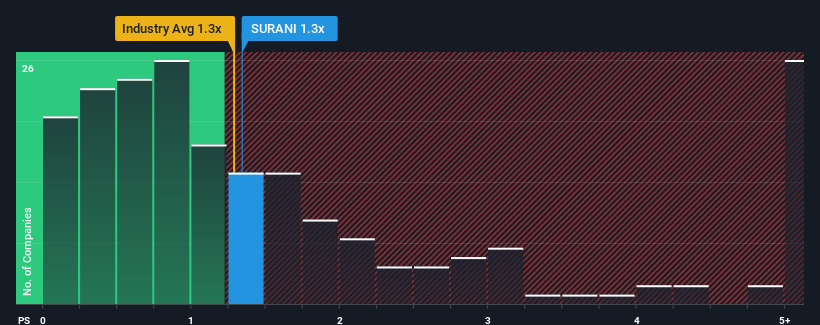
Although its price has dipped substantially, it's still not a stretch to say that Surani Steel Tubes' price-to-sales (or "P/S") ratio of 1.3x right now seems quite "middle-of-the-road" compared to the Metals and Mining industry in India, seeing as it matches the P/S ratio of the wider industry. While this might not raise any eyebrows, if the P/S ratio is not justified investors could be missing out on a potential opportunity or ignoring looming disappointment.
See our latest analysis for Surani Steel Tubes
What Does Surani Steel Tubes' P/S Mean For Shareholders?
Surani Steel Tubes has been doing a good job lately as it's been growing revenue at a solid pace. Perhaps the market is expecting future revenue performance to only keep up with the broader industry, which has keeping the P/S in line with expectations. If you like the company, you'd be hoping this isn't the case so that you could potentially pick up some stock while it's not quite in favour.
Although there are no analyst estimates available for Surani Steel Tubes, take a look at this free data-rich visualisation to see how the company stacks up on earnings, revenue and cash flow.Is There Some Revenue Growth Forecasted For Surani Steel Tubes?
The only time you'd be comfortable seeing a P/S like Surani Steel Tubes' is when the company's growth is tracking the industry closely.
Retrospectively, the last year delivered an exceptional 26% gain to the company's top line. The strong recent performance means it was also able to grow revenue by 46% in total over the last three years. Accordingly, shareholders would have definitely welcomed those medium-term rates of revenue growth.
This is in contrast to the rest of the industry, which is expected to grow by 16% over the next year, materially higher than the company's recent medium-term annualised growth rates.
In light of this, it's curious that Surani Steel Tubes' P/S sits in line with the majority of other companies. Apparently many investors in the company are less bearish than recent times would indicate and aren't willing to let go of their stock right now. They may be setting themselves up for future disappointment if the P/S falls to levels more in line with recent growth rates.
What Does Surani Steel Tubes' P/S Mean For Investors?
With its share price dropping off a cliff, the P/S for Surani Steel Tubes looks to be in line with the rest of the Metals and Mining industry. Using the price-to-sales ratio alone to determine if you should sell your stock isn't sensible, however it can be a practical guide to the company's future prospects.
We've established that Surani Steel Tubes' average P/S is a bit surprising since its recent three-year growth is lower than the wider industry forecast. When we see weak revenue with slower than industry growth, we suspect the share price is at risk of declining, bringing the P/S back in line with expectations. If recent medium-term revenue trends continue, the probability of a share price decline will become quite substantial, placing shareholders at risk.
Having said that, be aware Surani Steel Tubes is showing 2 warning signs in our investment analysis, and 1 of those makes us a bit uncomfortable.
Of course, profitable companies with a history of great earnings growth are generally safer bets. So you may wish to see this free collection of other companies that have reasonable P/E ratios and have grown earnings strongly.
New: Manage All Your Stock Portfolios in One Place
We've created the ultimate portfolio companion for stock investors, and it's free.
• Connect an unlimited number of Portfolios and see your total in one currency
• Be alerted to new Warning Signs or Risks via email or mobile
• Track the Fair Value of your stocks
Have feedback on this article? Concerned about the content? Get in touch with us directly. Alternatively, email editorial-team (at) simplywallst.com.
This article by Simply Wall St is general in nature. We provide commentary based on historical data and analyst forecasts only using an unbiased methodology and our articles are not intended to be financial advice. It does not constitute a recommendation to buy or sell any stock, and does not take account of your objectives, or your financial situation. We aim to bring you long-term focused analysis driven by fundamental data. Note that our analysis may not factor in the latest price-sensitive company announcements or qualitative material. Simply Wall St has no position in any stocks mentioned.
About NSEI:SURANI
Surani Steel Tubes
Engages in the manufacture and supply of ERW mild steel (MS) pipes and steel tubes in India.
Flawless balance sheet with solid track record.
Similar Companies
Market Insights

Advertisement
Community Narratives
Pinterest will surge as advertising innovations ignite revenue growth
Fair Value US$42.63|27.5% undervalued
BR
Community Contributor
Brambles' Revenue Set to Climb 14% with Profit Margins Following
Fair Value AU$21.90|4.2% overvalued
RO
Community Contributor
Challenging Future for STG as Organic Sales Decline by 8.8%
Fair Value DKK 116.13|27.0% undervalued
KA
Community Contributor