- India
- /
- Metals and Mining
- /
- NSEI:STEELXIND
Steel Exchange India Limited (NSE:STEELXIND) Stock Catapults 28% Though Its Price And Business Still Lag The Market

Steel Exchange India Limited (NSE:STEELXIND) shareholders would be excited to see that the share price has had a great month, posting a 28% gain and recovering from prior weakness. The annual gain comes to 172% following the latest surge, making investors sit up and take notice.
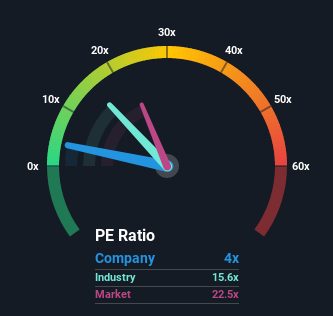
Although its price has surged higher, Steel Exchange India may still be sending very bullish signals at the moment with its price-to-earnings (or "P/E") ratio of 4x, since almost half of all companies in India have P/E ratios greater than 23x and even P/E's higher than 52x are not unusual. Although, it's not wise to just take the P/E at face value as there may be an explanation why it's so limited.
With earnings growth that's exceedingly strong of late, Steel Exchange India has been doing very well. It might be that many expect the strong earnings performance to degrade substantially, which has repressed the P/E. If you like the company, you'd be hoping this isn't the case so that you could potentially pick up some stock while it's out of favour.
See our latest analysis for Steel Exchange India

Is There Any Growth For Steel Exchange India?
There's an inherent assumption that a company should far underperform the market for P/E ratios like Steel Exchange India's to be considered reasonable.
Taking a look back first, we see that the company grew earnings per share by an impressive 116% last year. However, the latest three year period hasn't been as great in aggregate as it didn't manage to provide any growth at all. Accordingly, shareholders probably wouldn't have been overly satisfied with the unstable medium-term growth rates.
This is in contrast to the rest of the market, which is expected to grow by 26% over the next year, materially higher than the company's recent medium-term annualised growth rates.
In light of this, it's understandable that Steel Exchange India's P/E sits below the majority of other companies. It seems most investors are expecting to see the recent limited growth rates continue into the future and are only willing to pay a reduced amount for the stock.
What We Can Learn From Steel Exchange India's P/E?
Even after such a strong price move, Steel Exchange India's P/E still trails the rest of the market significantly. It's argued the price-to-earnings ratio is an inferior measure of value within certain industries, but it can be a powerful business sentiment indicator.
We've established that Steel Exchange India maintains its low P/E on the weakness of its recent three-year growth being lower than the wider market forecast, as expected. Right now shareholders are accepting the low P/E as they concede future earnings probably won't provide any pleasant surprises. Unless the recent medium-term conditions improve, they will continue to form a barrier for the share price around these levels.
It is also worth noting that we have found 5 warning signs for Steel Exchange India (1 is a bit concerning!) that you need to take into consideration.
If you're unsure about the strength of Steel Exchange India's business, why not explore our interactive list of stocks with solid business fundamentals for some other companies you may have missed.
If you’re looking to trade Steel Exchange India, open an account with the lowest-cost* platform trusted by professionals, Interactive Brokers. Their clients from over 200 countries and territories trade stocks, options, futures, forex, bonds and funds worldwide from a single integrated account. Promoted
If you're looking to trade Steel Exchange India, open an account with the lowest-cost platform trusted by professionals, Interactive Brokers.
With clients in over 200 countries and territories, and access to 160 markets, IBKR lets you trade stocks, options, futures, forex, bonds and funds from a single integrated account.
Enjoy no hidden fees, no account minimums, and FX conversion rates as low as 0.03%, far better than what most brokers offer.
Sponsored ContentNew: Manage All Your Stock Portfolios in One Place
We've created the ultimate portfolio companion for stock investors, and it's free.
• Connect an unlimited number of Portfolios and see your total in one currency
• Be alerted to new Warning Signs or Risks via email or mobile
• Track the Fair Value of your stocks
This article by Simply Wall St is general in nature. It does not constitute a recommendation to buy or sell any stock, and does not take account of your objectives, or your financial situation. We aim to bring you long-term focused analysis driven by fundamental data. Note that our analysis may not factor in the latest price-sensitive company announcements or qualitative material. Simply Wall St has no position in any stocks mentioned.
*Interactive Brokers Rated Lowest Cost Broker by StockBrokers.com Annual Online Review 2020
Have feedback on this article? Concerned about the content? Get in touch with us directly. Alternatively, email editorial-team (at) simplywallst.com.
About NSEI:STEELXIND
Steel Exchange India
Engages in the manufacture and sale of steel products under the SIMHADRI TMT brand name in India.
Acceptable track record with mediocre balance sheet.
Similar Companies
Market Insights
Community Narratives


