
Advertisement
- India
- /
- Basic Materials
- /
- NSEI:STARCEMENT
Estimating The Fair Value Of Star Cement Limited (NSE:STARCEMENT)
Key Insights
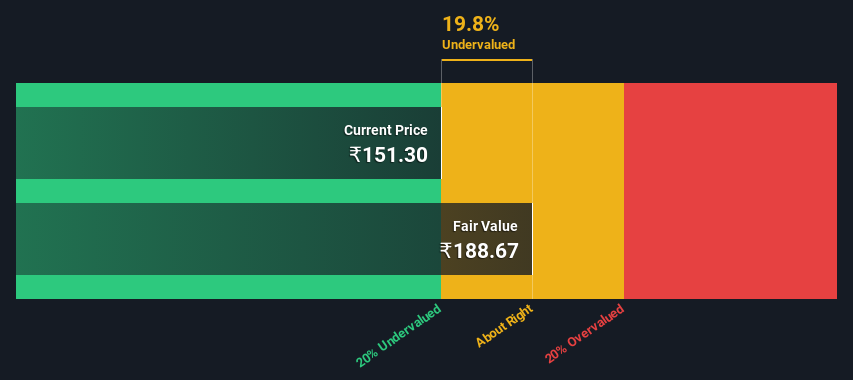
- The projected fair value for Star Cement is ₹189 based on 2 Stage Free Cash Flow to Equity
- With ₹151 share price, Star Cement appears to be trading close to its estimated fair value
- The ₹151 analyst price target for STARCEMENT is 20% less than our estimate of fair value
How far off is Star Cement Limited (NSE:STARCEMENT) from its intrinsic value? Using the most recent financial data, we'll take a look at whether the stock is fairly priced by taking the expected future cash flows and discounting them to today's value. One way to achieve this is by employing the Discounted Cash Flow (DCF) model. Believe it or not, it's not too difficult to follow, as you'll see from our example!
We generally believe that a company's value is the present value of all of the cash it will generate in the future. However, a DCF is just one valuation metric among many, and it is not without flaws. If you still have some burning questions about this type of valuation, take a look at the Simply Wall St analysis model.
See our latest analysis for Star Cement
What's The Estimated Valuation?
We use what is known as a 2-stage model, which simply means we have two different periods of growth rates for the company's cash flows. Generally the first stage is higher growth, and the second stage is a lower growth phase. To begin with, we have to get estimates of the next ten years of cash flows. Where possible we use analyst estimates, but when these aren't available we extrapolate the previous free cash flow (FCF) from the last estimate or reported value. We assume companies with shrinking free cash flow will slow their rate of shrinkage, and that companies with growing free cash flow will see their growth rate slow, over this period. We do this to reflect that growth tends to slow more in the early years than it does in later years.
Generally we assume that a dollar today is more valuable than a dollar in the future, so we discount the value of these future cash flows to their estimated value in today's dollars:
10-year free cash flow (FCF) forecast
| 2024 | 2025 | 2026 | 2027 | 2028 | 2029 | 2030 | 2031 | 2032 | 2033 | |
| Levered FCF (₹, Millions) | -₹7.52b | ₹643.8m | ₹2.01b | ₹3.38b | ₹5.07b | ₹6.95b | ₹8.89b | ₹10.8b | ₹12.6b | ₹14.4b |
| Growth Rate Estimate Source | Analyst x5 | Analyst x5 | Analyst x1 | Est @ 68.37% | Est @ 49.89% | Est @ 36.95% | Est @ 27.89% | Est @ 21.55% | Est @ 17.12% | Est @ 14.01% |
| Present Value (₹, Millions) Discounted @ 14% | -₹6.6k | ₹496 | ₹1.4k | ₹2.0k | ₹2.6k | ₹3.2k | ₹3.6k | ₹3.8k | ₹3.9k | ₹3.9k |
("Est" = FCF growth rate estimated by Simply Wall St)
Present Value of 10-year Cash Flow (PVCF) = ₹18b
After calculating the present value of future cash flows in the initial 10-year period, we need to calculate the Terminal Value, which accounts for all future cash flows beyond the first stage. For a number of reasons a very conservative growth rate is used that cannot exceed that of a country's GDP growth. In this case we have used the 5-year average of the 10-year government bond yield (6.8%) to estimate future growth. In the same way as with the 10-year 'growth' period, we discount future cash flows to today's value, using a cost of equity of 14%.
Terminal Value (TV)= FCF2033 × (1 + g) ÷ (r – g) = ₹14b× (1 + 6.8%) ÷ (14%– 6.8%) = ₹214b
Present Value of Terminal Value (PVTV)= TV / (1 + r)10= ₹214b÷ ( 1 + 14%)10= ₹58b
The total value, or equity value, is then the sum of the present value of the future cash flows, which in this case is ₹76b. To get the intrinsic value per share, we divide this by the total number of shares outstanding. Compared to the current share price of ₹151, the company appears about fair value at a 20% discount to where the stock price trades currently. The assumptions in any calculation have a big impact on the valuation, so it is better to view this as a rough estimate, not precise down to the last cent.
Important Assumptions
The calculation above is very dependent on two assumptions. The first is the discount rate and the other is the cash flows. If you don't agree with these result, have a go at the calculation yourself and play with the assumptions. The DCF also does not consider the possible cyclicality of an industry, or a company's future capital requirements, so it does not give a full picture of a company's potential performance. Given that we are looking at Star Cement as potential shareholders, the cost of equity is used as the discount rate, rather than the cost of capital (or weighted average cost of capital, WACC) which accounts for debt. In this calculation we've used 14%, which is based on a levered beta of 0.864. Beta is a measure of a stock's volatility, compared to the market as a whole. We get our beta from the industry average beta of globally comparable companies, with an imposed limit between 0.8 and 2.0, which is a reasonable range for a stable business.
SWOT Analysis for Star Cement
Strength
- Earnings growth over the past year exceeded the industry.
- Debt is not viewed as a risk.
Weakness
- No major weaknesses identified for STARCEMENT.
Opportunity
- Annual revenue is forecast to grow faster than the Indian market.
- Current share price is below our estimate of fair value.
Threat
- Annual earnings are forecast to grow slower than the Indian market.
Next Steps:
Whilst important, the DCF calculation shouldn't be the only metric you look at when researching a company. It's not possible to obtain a foolproof valuation with a DCF model. Instead the best use for a DCF model is to test certain assumptions and theories to see if they would lead to the company being undervalued or overvalued. For instance, if the terminal value growth rate is adjusted slightly, it can dramatically alter the overall result. For Star Cement, we've compiled three pertinent items you should further examine:
- Risks: Take risks, for example - Star Cement has 1 warning sign we think you should be aware of.
- Management:Have insiders been ramping up their shares to take advantage of the market's sentiment for STARCEMENT's future outlook? Check out our management and board analysis with insights on CEO compensation and governance factors.
- Other High Quality Alternatives: Do you like a good all-rounder? Explore our interactive list of high quality stocks to get an idea of what else is out there you may be missing!
PS. The Simply Wall St app conducts a discounted cash flow valuation for every stock on the NSEI every day. If you want to find the calculation for other stocks just search here.
New: Manage All Your Stock Portfolios in One Place
We've created the ultimate portfolio companion for stock investors, and it's free.
• Connect an unlimited number of Portfolios and see your total in one currency
• Be alerted to new Warning Signs or Risks via email or mobile
• Track the Fair Value of your stocks
Have feedback on this article? Concerned about the content? Get in touch with us directly. Alternatively, email editorial-team (at) simplywallst.com.
This article by Simply Wall St is general in nature. We provide commentary based on historical data and analyst forecasts only using an unbiased methodology and our articles are not intended to be financial advice. It does not constitute a recommendation to buy or sell any stock, and does not take account of your objectives, or your financial situation. We aim to bring you long-term focused analysis driven by fundamental data. Note that our analysis may not factor in the latest price-sensitive company announcements or qualitative material. Simply Wall St has no position in any stocks mentioned.
About NSEI:STARCEMENT
Star Cement
Manufactures and sells cement and clinker products in India and internationally.
Reasonable growth potential with adequate balance sheet.
Similar Companies
Market Insights

Advertisement
Community Narratives
The Most Undervalued of the Magnificent 7
Fair Value US$237.43|36.3% undervalued
IN
Community Contributor
PVA TePla's New Strategy Aims for 22% Revenue Growth in Semiconductor Recovery
Fair Value €19.19|20.8% undervalued
MI
Community Contributor