Southern Petrochemical Industries (NSE:SPIC) stock performs better than its underlying earnings growth over last five years


We think all investors should try to buy and hold high quality multi-year winners. And highest quality companies can see their share prices grow by huge amounts. For example, the Southern Petrochemical Industries Corporation Limited (NSE:SPIC) share price is up a whopping 325% in the last half decade, a handsome return for long term holders. This just goes to show the value creation that some businesses can achieve. It's also good to see the share price up 44% over the last quarter. But this move may well have been assisted by the reasonably buoyant market (up 19% in 90 days).
The past week has proven to be lucrative for Southern Petrochemical Industries investors, so let's see if fundamentals drove the company's five-year performance.
See our latest analysis for Southern Petrochemical Industries
To quote Buffett, 'Ships will sail around the world but the Flat Earth Society will flourish. There will continue to be wide discrepancies between price and value in the marketplace...' One flawed but reasonable way to assess how sentiment around a company has changed is to compare the earnings per share (EPS) with the share price.
During five years of share price growth, Southern Petrochemical Industries achieved compound earnings per share (EPS) growth of 28% per year. This EPS growth is reasonably close to the 34% average annual increase in the share price. Therefore one could conclude that sentiment towards the shares hasn't morphed very much. Indeed, it would appear the share price is reacting to the EPS.
You can see how EPS has changed over time in the image below (click on the chart to see the exact values).
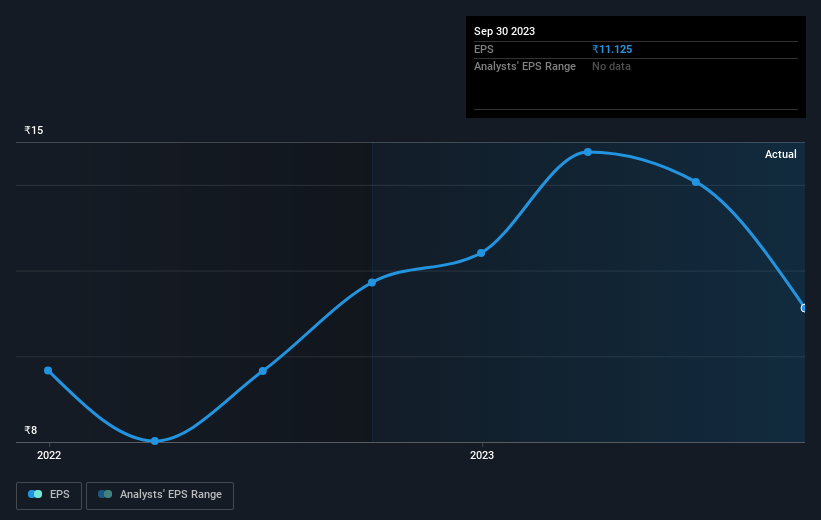
Dive deeper into Southern Petrochemical Industries' key metrics by checking this interactive graph of Southern Petrochemical Industries's earnings, revenue and cash flow.
What About Dividends?
It is important to consider the total shareholder return, as well as the share price return, for any given stock. The TSR incorporates the value of any spin-offs or discounted capital raisings, along with any dividends, based on the assumption that the dividends are reinvested. So for companies that pay a generous dividend, the TSR is often a lot higher than the share price return. As it happens, Southern Petrochemical Industries' TSR for the last 5 years was 337%, which exceeds the share price return mentioned earlier. And there's no prize for guessing that the dividend payments largely explain the divergence!
A Different Perspective
Southern Petrochemical Industries' TSR for the year was broadly in line with the market average, at 46%. Most would be happy with a gain, and it helps that the year's return is actually better than the average return over five years, which was 34%. It is possible that management foresight will bring growth well into the future, even if the share price slows down. While it is well worth considering the different impacts that market conditions can have on the share price, there are other factors that are even more important. Consider for instance, the ever-present spectre of investment risk. We've identified 2 warning signs with Southern Petrochemical Industries (at least 1 which is potentially serious) , and understanding them should be part of your investment process.
We will like Southern Petrochemical Industries better if we see some big insider buys. While we wait, check out this free list of growing companies with considerable, recent, insider buying.
Please note, the market returns quoted in this article reflect the market weighted average returns of stocks that currently trade on Indian exchanges.
New: Manage All Your Stock Portfolios in One Place
We've created the ultimate portfolio companion for stock investors, and it's free.
• Connect an unlimited number of Portfolios and see your total in one currency
• Be alerted to new Warning Signs or Risks via email or mobile
• Track the Fair Value of your stocks
Have feedback on this article? Concerned about the content? Get in touch with us directly. Alternatively, email editorial-team (at) simplywallst.com.
This article by Simply Wall St is general in nature. We provide commentary based on historical data and analyst forecasts only using an unbiased methodology and our articles are not intended to be financial advice. It does not constitute a recommendation to buy or sell any stock, and does not take account of your objectives, or your financial situation. We aim to bring you long-term focused analysis driven by fundamental data. Note that our analysis may not factor in the latest price-sensitive company announcements or qualitative material. Simply Wall St has no position in any stocks mentioned.
About NSEI:SPIC
Southern Petrochemical Industries
Engages in the manufacture and sale of fertilizers in India and internationally.
Excellent balance sheet second-rate dividend payer.
Similar Companies
Market Insights

Community Narratives

