Not Many Are Piling Into Sampann Utpadan India Limited (NSE:SAMPANN) Just Yet

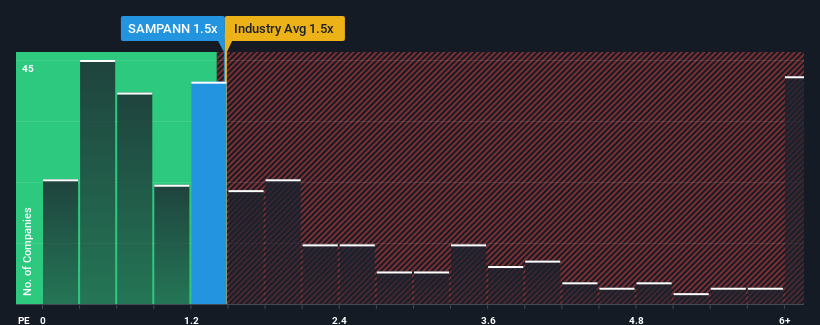
There wouldn't be many who think Sampann Utpadan India Limited's (NSE:SAMPANN) price-to-sales (or "P/S") ratio of 1.5x is worth a mention when the median P/S for the Chemicals industry in India is very similar. Although, it's not wise to simply ignore the P/S without explanation as investors may be disregarding a distinct opportunity or a costly mistake.
Check out our latest analysis for Sampann Utpadan India
What Does Sampann Utpadan India's P/S Mean For Shareholders?
Sampann Utpadan India has been doing a good job lately as it's been growing revenue at a solid pace. Perhaps the market is expecting future revenue performance to only keep up with the broader industry, which has keeping the P/S in line with expectations. If that doesn't eventuate, then existing shareholders probably aren't too pessimistic about the future direction of the share price.
We don't have analyst forecasts, but you can see how recent trends are setting up the company for the future by checking out our free report on Sampann Utpadan India's earnings, revenue and cash flow.How Is Sampann Utpadan India's Revenue Growth Trending?
There's an inherent assumption that a company should be matching the industry for P/S ratios like Sampann Utpadan India's to be considered reasonable.
Taking a look back first, we see that the company grew revenue by an impressive 30% last year. The latest three year period has also seen an excellent 93% overall rise in revenue, aided by its short-term performance. Accordingly, shareholders would have definitely welcomed those medium-term rates of revenue growth.
When compared to the industry's one-year growth forecast of 14%, the most recent medium-term revenue trajectory is noticeably more alluring
In light of this, it's curious that Sampann Utpadan India's P/S sits in line with the majority of other companies. Apparently some shareholders believe the recent performance is at its limits and have been accepting lower selling prices.
What We Can Learn From Sampann Utpadan India's P/S?
It's argued the price-to-sales ratio is an inferior measure of value within certain industries, but it can be a powerful business sentiment indicator.
We didn't quite envision Sampann Utpadan India's P/S sitting in line with the wider industry, considering the revenue growth over the last three-year is higher than the current industry outlook. When we see strong revenue with faster-than-industry growth, we can only assume potential risks are what might be placing pressure on the P/S ratio. While recent revenue trends over the past medium-term suggest that the risk of a price decline is low, investors appear to see the likelihood of revenue fluctuations in the future.
Before you settle on your opinion, we've discovered 3 warning signs for Sampann Utpadan India (1 is concerning!) that you should be aware of.
If these risks are making you reconsider your opinion on Sampann Utpadan India, explore our interactive list of high quality stocks to get an idea of what else is out there.
Mobile Infrastructure for Defense and Disaster
The next wave in robotics isn't humanoid. Its fully autonomous towers delivering 5G, ISR, and radar in under 30 minutes, anywhere.
Get the investor briefing before the next round of contracts
Sponsored On Behalf of CiTechNew: Manage All Your Stock Portfolios in One Place
We've created the ultimate portfolio companion for stock investors, and it's free.
• Connect an unlimited number of Portfolios and see your total in one currency
• Be alerted to new Warning Signs or Risks via email or mobile
• Track the Fair Value of your stocks
Have feedback on this article? Concerned about the content? Get in touch with us directly. Alternatively, email editorial-team (at) simplywallst.com.
This article by Simply Wall St is general in nature. We provide commentary based on historical data and analyst forecasts only using an unbiased methodology and our articles are not intended to be financial advice. It does not constitute a recommendation to buy or sell any stock, and does not take account of your objectives, or your financial situation. We aim to bring you long-term focused analysis driven by fundamental data. Note that our analysis may not factor in the latest price-sensitive company announcements or qualitative material. Simply Wall St has no position in any stocks mentioned.
About NSEI:SAMPANN
Sampann Utpadan India
Manufactures and sells reclaimed rubber products in India.
Moderate risk and slightly overvalued.
Market Insights

Weekly Picks

THE KINGDOM OF BROWN GOODS: WHY MGPI IS BEING CRUSHED BY INVENTORY & PRIMED FOR RESURRECTION


Why Vertical Aerospace (NYSE: EVTL) is Worth Possibly Over 13x its Current Price


The Quiet Giant That Became AI’s Power Grid
Recently Updated Narratives

Deep Value Multi Bagger Opportunity


A case for CA$31.80 (undiluted), aka 8,616% upside from CA$0.37 (an 86 bagger!).


Unicycive Therapeutics (Nasdaq: UNCY) – Preparing for a Second Shot at Bringing a New Kidney Treatment to Market (TEST)
Popular Narratives


MicroVision will explode future revenue by 380.37% with a vision towards success


NVDA: Expanding AI Demand Will Drive Major Data Center Investments Through 2026


Crazy Undervalued 42 Baggers Silver Play (Active & Running Mine)
Trending Discussion

