Plastiblends India's (NSE:PLASTIBLEN) Returns On Capital Not Reflecting Well On The Business


If you're not sure where to start when looking for the next multi-bagger, there are a few key trends you should keep an eye out for. Firstly, we'd want to identify a growing return on capital employed (ROCE) and then alongside that, an ever-increasing base of capital employed. If you see this, it typically means it's a company with a great business model and plenty of profitable reinvestment opportunities. However, after briefly looking over the numbers, we don't think Plastiblends India (NSE:PLASTIBLEN) has the makings of a multi-bagger going forward, but let's have a look at why that may be.
What Is Return On Capital Employed (ROCE)?
For those who don't know, ROCE is a measure of a company's yearly pre-tax profit (its return), relative to the capital employed in the business. To calculate this metric for Plastiblends India, this is the formula:
Return on Capital Employed = Earnings Before Interest and Tax (EBIT) ÷ (Total Assets - Current Liabilities)
0.096 = ₹415m ÷ (₹5.1b - ₹796m) (Based on the trailing twelve months to December 2023).
Thus, Plastiblends India has an ROCE of 9.6%. Ultimately, that's a low return and it under-performs the Chemicals industry average of 14%.
View our latest analysis for Plastiblends India
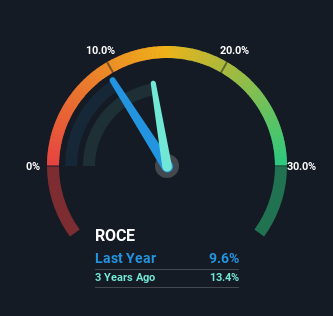
Historical performance is a great place to start when researching a stock so above you can see the gauge for Plastiblends India's ROCE against it's prior returns. If you're interested in investigating Plastiblends India's past further, check out this free graph covering Plastiblends India's past earnings, revenue and cash flow.
What Can We Tell From Plastiblends India's ROCE Trend?
When we looked at the ROCE trend at Plastiblends India, we didn't gain much confidence. To be more specific, ROCE has fallen from 18% over the last five years. Meanwhile, the business is utilizing more capital but this hasn't moved the needle much in terms of sales in the past 12 months, so this could reflect longer term investments. It's worth keeping an eye on the company's earnings from here on to see if these investments do end up contributing to the bottom line.
On a side note, Plastiblends India has done well to pay down its current liabilities to 16% of total assets. So we could link some of this to the decrease in ROCE. What's more, this can reduce some aspects of risk to the business because now the company's suppliers or short-term creditors are funding less of its operations. Since the business is basically funding more of its operations with it's own money, you could argue this has made the business less efficient at generating ROCE.
The Bottom Line On Plastiblends India's ROCE
In summary, Plastiblends India is reinvesting funds back into the business for growth but unfortunately it looks like sales haven't increased much just yet. And investors may be recognizing these trends since the stock has only returned a total of 31% to shareholders over the last five years. As a result, if you're hunting for a multi-bagger, we think you'd have more luck elsewhere.
One more thing: We've identified 3 warning signs with Plastiblends India (at least 1 which doesn't sit too well with us) , and understanding them would certainly be useful.
For those who like to invest in solid companies, check out this free list of companies with solid balance sheets and high returns on equity.
If you're looking to trade Plastiblends India, open an account with the lowest-cost platform trusted by professionals, Interactive Brokers.
With clients in over 200 countries and territories, and access to 160 markets, IBKR lets you trade stocks, options, futures, forex, bonds and funds from a single integrated account.
Enjoy no hidden fees, no account minimums, and FX conversion rates as low as 0.03%, far better than what most brokers offer.
Sponsored ContentNew: Manage All Your Stock Portfolios in One Place
We've created the ultimate portfolio companion for stock investors, and it's free.
• Connect an unlimited number of Portfolios and see your total in one currency
• Be alerted to new Warning Signs or Risks via email or mobile
• Track the Fair Value of your stocks
Have feedback on this article? Concerned about the content? Get in touch with us directly. Alternatively, email editorial-team (at) simplywallst.com.
This article by Simply Wall St is general in nature. We provide commentary based on historical data and analyst forecasts only using an unbiased methodology and our articles are not intended to be financial advice. It does not constitute a recommendation to buy or sell any stock, and does not take account of your objectives, or your financial situation. We aim to bring you long-term focused analysis driven by fundamental data. Note that our analysis may not factor in the latest price-sensitive company announcements or qualitative material. Simply Wall St has no position in any stocks mentioned.
About NSEI:PLASTIBLEN
Plastiblends India
Engages in the manufacturing of masterbatches in India and internationally.
Flawless balance sheet second-rate dividend payer.
Market Insights

Community Narratives


