The total return for National Fertilizers (NSE:NFL) investors has risen faster than earnings growth over the last five years


It hasn't been the best quarter for National Fertilizers Limited (NSE:NFL) shareholders, since the share price has fallen 20% in that time. But that doesn't undermine the fantastic longer term performance (measured over five years). To be precise, the stock price is 372% higher than it was five years ago, a wonderful performance by any measure. So we don't think the recent decline in the share price means its story is a sad one. The most important thing for savvy investors to consider is whether the underlying business can justify the share price gain.
Although National Fertilizers has shed ₹4.9b from its market cap this week, let's take a look at its longer term fundamental trends and see if they've driven returns.
Check out our latest analysis for National Fertilizers
There is no denying that markets are sometimes efficient, but prices do not always reflect underlying business performance. One flawed but reasonable way to assess how sentiment around a company has changed is to compare the earnings per share (EPS) with the share price.
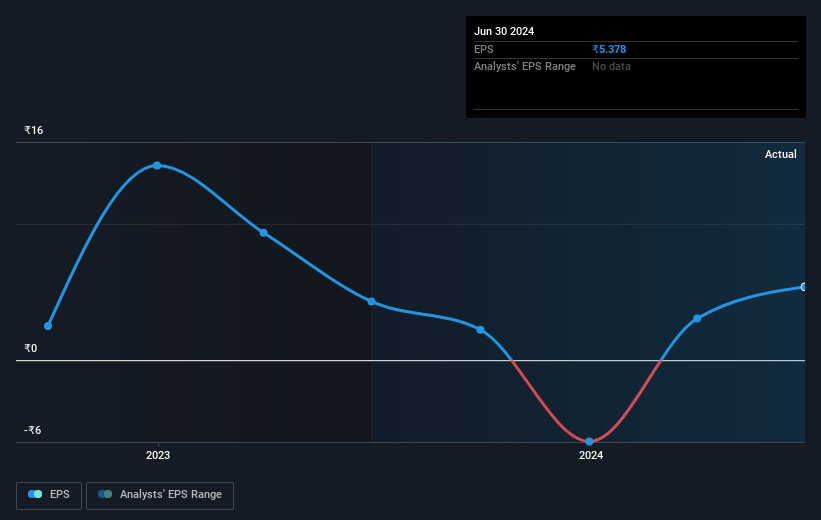
Over half a decade, National Fertilizers managed to grow its earnings per share at 6.7% a year. This EPS growth is lower than the 36% average annual increase in the share price. So it's fair to assume the market has a higher opinion of the business than it did five years ago. That's not necessarily surprising considering the five-year track record of earnings growth.
You can see how EPS has changed over time in the image below (click on the chart to see the exact values).
It's probably worth noting that the CEO is paid less than the median at similar sized companies. But while CEO remuneration is always worth checking, the really important question is whether the company can grow earnings going forward. This free interactive report on National Fertilizers' earnings, revenue and cash flow is a great place to start, if you want to investigate the stock further.
What About Dividends?
When looking at investment returns, it is important to consider the difference between total shareholder return (TSR) and share price return. The TSR is a return calculation that accounts for the value of cash dividends (assuming that any dividend received was reinvested) and the calculated value of any discounted capital raisings and spin-offs. It's fair to say that the TSR gives a more complete picture for stocks that pay a dividend. As it happens, National Fertilizers' TSR for the last 5 years was 418%, which exceeds the share price return mentioned earlier. And there's no prize for guessing that the dividend payments largely explain the divergence!
A Different Perspective
We're pleased to report that National Fertilizers shareholders have received a total shareholder return of 69% over one year. And that does include the dividend. Since the one-year TSR is better than the five-year TSR (the latter coming in at 39% per year), it would seem that the stock's performance has improved in recent times. Given the share price momentum remains strong, it might be worth taking a closer look at the stock, lest you miss an opportunity. While it is well worth considering the different impacts that market conditions can have on the share price, there are other factors that are even more important. For instance, we've identified 1 warning sign for National Fertilizers that you should be aware of.
If you are like me, then you will not want to miss this free list of undervalued small caps that insiders are buying.
Please note, the market returns quoted in this article reflect the market weighted average returns of stocks that currently trade on Indian exchanges.
Valuation is complex, but we're here to simplify it.
Discover if National Fertilizers might be undervalued or overvalued with our detailed analysis, featuring fair value estimates, potential risks, dividends, insider trades, and its financial condition.
Access Free AnalysisHave feedback on this article? Concerned about the content? Get in touch with us directly. Alternatively, email editorial-team (at) simplywallst.com.
This article by Simply Wall St is general in nature. We provide commentary based on historical data and analyst forecasts only using an unbiased methodology and our articles are not intended to be financial advice. It does not constitute a recommendation to buy or sell any stock, and does not take account of your objectives, or your financial situation. We aim to bring you long-term focused analysis driven by fundamental data. Note that our analysis may not factor in the latest price-sensitive company announcements or qualitative material. Simply Wall St has no position in any stocks mentioned.
About NSEI:NFL
National Fertilizers
Engages in the production and marketing of neem coated urea, bio-fertilizers, and other allied Industrial products in India.
Acceptable track record second-rate dividend payer.
Similar Companies
Market Insights

Community Narratives

