
Advertisement
- India
- /
- Metals and Mining
- /
- NSEI:LLOYDSME
Lloyds Metals and Energy Limited (NSE:LLOYDSME) Looks Just Right With A 25% Price Jump

The Lloyds Metals and Energy Limited (NSE:LLOYDSME) share price has done very well over the last month, posting an excellent gain of 25%. While recent buyers may be laughing, long-term holders might not be as pleased since the recent gain only brings the stock back to where it started a year ago.
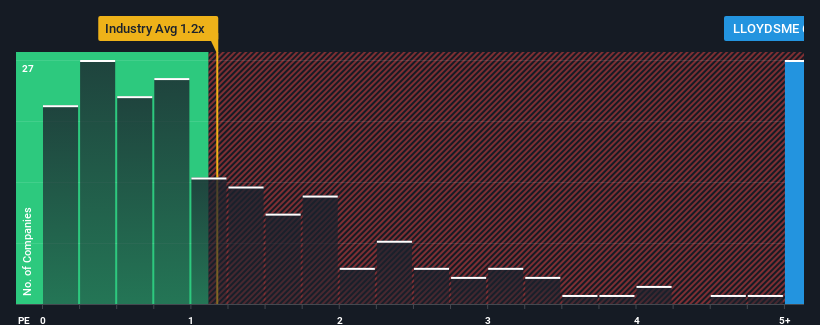
After such a large jump in price, given around half the companies in India's Metals and Mining industry have price-to-sales ratios (or "P/S") below 1.2x, you may consider Lloyds Metals and Energy as a stock to avoid entirely with its 6.3x P/S ratio. Although, it's not wise to just take the P/S at face value as there may be an explanation why it's so lofty.
View our latest analysis for Lloyds Metals and Energy
What Does Lloyds Metals and Energy's Recent Performance Look Like?
Recent times have been advantageous for Lloyds Metals and Energy as its revenues have been rising faster than most other companies. The P/S is probably high because investors think this strong revenue performance will continue. If not, then existing shareholders might be a little nervous about the viability of the share price.
If you'd like to see what analysts are forecasting going forward, you should check out our free report on Lloyds Metals and Energy.How Is Lloyds Metals and Energy's Revenue Growth Trending?
The only time you'd be truly comfortable seeing a P/S as steep as Lloyds Metals and Energy's is when the company's growth is on track to outshine the industry decidedly.
Taking a look back first, we see that the company grew revenue by an impressive 105% last year. This great performance means it was also able to deliver immense revenue growth over the last three years. Therefore, it's fair to say the revenue growth recently has been superb for the company.
Turning to the outlook, the next year should generate growth of 41% as estimated by the sole analyst watching the company. Meanwhile, the rest of the industry is forecast to only expand by 7.6%, which is noticeably less attractive.
With this information, we can see why Lloyds Metals and Energy is trading at such a high P/S compared to the industry. It seems most investors are expecting this strong future growth and are willing to pay more for the stock.
What Does Lloyds Metals and Energy's P/S Mean For Investors?
Shares in Lloyds Metals and Energy have seen a strong upwards swing lately, which has really helped boost its P/S figure. Using the price-to-sales ratio alone to determine if you should sell your stock isn't sensible, however it can be a practical guide to the company's future prospects.
Our look into Lloyds Metals and Energy shows that its P/S ratio remains high on the merit of its strong future revenues. It appears that shareholders are confident in the company's future revenues, which is propping up the P/S. Unless these conditions change, they will continue to provide strong support to the share price.
The company's balance sheet is another key area for risk analysis. Our free balance sheet analysis for Lloyds Metals and Energy with six simple checks will allow you to discover any risks that could be an issue.
It's important to make sure you look for a great company, not just the first idea you come across. So if growing profitability aligns with your idea of a great company, take a peek at this free list of interesting companies with strong recent earnings growth (and a low P/E).
New: AI Stock Screener & Alerts
Our new AI Stock Screener scans the market every day to uncover opportunities.
• Dividend Powerhouses (3%+ Yield)
• Undervalued Small Caps with Insider Buying
• High growth Tech and AI Companies
Or build your own from over 50 metrics.
Have feedback on this article? Concerned about the content? Get in touch with us directly. Alternatively, email editorial-team (at) simplywallst.com.
This article by Simply Wall St is general in nature. We provide commentary based on historical data and analyst forecasts only using an unbiased methodology and our articles are not intended to be financial advice. It does not constitute a recommendation to buy or sell any stock, and does not take account of your objectives, or your financial situation. We aim to bring you long-term focused analysis driven by fundamental data. Note that our analysis may not factor in the latest price-sensitive company announcements or qualitative material. Simply Wall St has no position in any stocks mentioned.
About NSEI:LLOYDSME
Lloyds Metals and Energy
Manufactures and sells sponge iron products in India.
Exceptional growth potential with flawless balance sheet.
Similar Companies
Market Insights


Advertisement
Community Narratives
Nike's Direct-to-Consumer Focus Will Drive Future Growth
Fair Value US$87.90|18.2% undervalued
UN
Community Contributor
Novo Nordisk will dominate GLP-1 market with Ozempic and Wegovy growth
Fair Value US$89.59|12.1% undervalued
BE
Community Contributor
Rheinmetall could get 20-25% of EU-NATO 3%-GDP defence spending
Fair Value €7.57k|82.4% undervalued
NO
Community Contributor