
Advertisement
- India
- /
- Metals and Mining
- /
- NSEI:HISARMETAL
A Look At The Fair Value Of Hisar Metal Industries Limited (NSE:HISARMETAL)

Key Insights
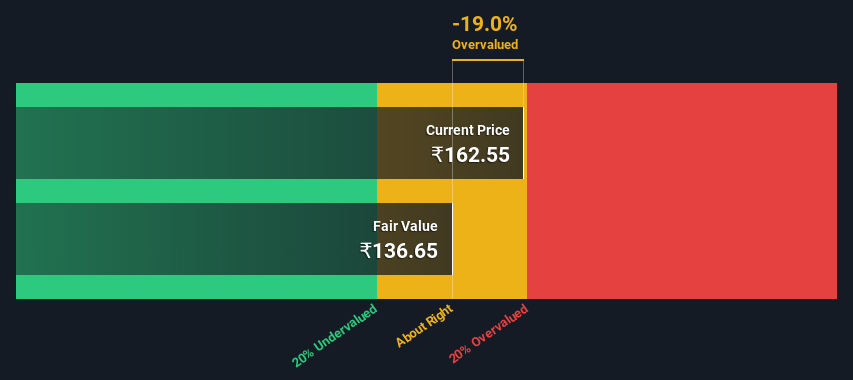
- The projected fair value for Hisar Metal Industries is ₹137 based on 2 Stage Free Cash Flow to Equity
- With ₹163 share price, Hisar Metal Industries appears to be trading close to its estimated fair value
- When compared to theindustry average discount of -198%, Hisar Metal Industries' competitors seem to be trading at a greater premium to fair value
Today we will run through one way of estimating the intrinsic value of Hisar Metal Industries Limited (NSE:HISARMETAL) by taking the forecast future cash flows of the company and discounting them back to today's value. The Discounted Cash Flow (DCF) model is the tool we will apply to do this. It may sound complicated, but actually it is quite simple!
We would caution that there are many ways of valuing a company and, like the DCF, each technique has advantages and disadvantages in certain scenarios. For those who are keen learners of equity analysis, the Simply Wall St analysis model here may be something of interest to you.
See our latest analysis for Hisar Metal Industries
The Method
We are going to use a two-stage DCF model, which, as the name states, takes into account two stages of growth. The first stage is generally a higher growth period which levels off heading towards the terminal value, captured in the second 'steady growth' period. To start off with, we need to estimate the next ten years of cash flows. Seeing as no analyst estimates of free cash flow are available to us, we have extrapolate the previous free cash flow (FCF) from the company's last reported value. We assume companies with shrinking free cash flow will slow their rate of shrinkage, and that companies with growing free cash flow will see their growth rate slow, over this period. We do this to reflect that growth tends to slow more in the early years than it does in later years.
A DCF is all about the idea that a dollar in the future is less valuable than a dollar today, so we need to discount the sum of these future cash flows to arrive at a present value estimate:
10-year free cash flow (FCF) estimate
| 2024 | 2025 | 2026 | 2027 | 2028 | 2029 | 2030 | 2031 | 2032 | 2033 | |
| Levered FCF (₹, Millions) | ₹85.3m | ₹92.5m | ₹99.8m | ₹107.3m | ₹115.1m | ₹123.3m | ₹132.0m | ₹141.1m | ₹150.8m | ₹161.0m |
| Growth Rate Estimate Source | Est @ 9.14% | Est @ 8.41% | Est @ 7.90% | Est @ 7.55% | Est @ 7.29% | Est @ 7.12% | Est @ 7.00% | Est @ 6.91% | Est @ 6.85% | Est @ 6.81% |
| Present Value (₹, Millions) Discounted @ 19% | ₹71.9 | ₹65.7 | ₹59.8 | ₹54.2 | ₹49.0 | ₹44.2 | ₹39.9 | ₹36.0 | ₹32.4 | ₹29.2 |
("Est" = FCF growth rate estimated by Simply Wall St)
Present Value of 10-year Cash Flow (PVCF) = ₹482m
After calculating the present value of future cash flows in the initial 10-year period, we need to calculate the Terminal Value, which accounts for all future cash flows beyond the first stage. The Gordon Growth formula is used to calculate Terminal Value at a future annual growth rate equal to the 5-year average of the 10-year government bond yield of 6.7%. We discount the terminal cash flows to today's value at a cost of equity of 19%.
Terminal Value (TV)= FCF2033 × (1 + g) ÷ (r – g) = ₹161m× (1 + 6.7%) ÷ (19%– 6.7%) = ₹1.4b
Present Value of Terminal Value (PVTV)= TV / (1 + r)10= ₹1.4b÷ ( 1 + 19%)10= ₹261m
The total value, or equity value, is then the sum of the present value of the future cash flows, which in this case is ₹743m. In the final step we divide the equity value by the number of shares outstanding. Compared to the current share price of ₹163, the company appears around fair value at the time of writing. Remember though, that this is just an approximate valuation, and like any complex formula - garbage in, garbage out.
Important Assumptions
Now the most important inputs to a discounted cash flow are the discount rate, and of course, the actual cash flows. If you don't agree with these result, have a go at the calculation yourself and play with the assumptions. The DCF also does not consider the possible cyclicality of an industry, or a company's future capital requirements, so it does not give a full picture of a company's potential performance. Given that we are looking at Hisar Metal Industries as potential shareholders, the cost of equity is used as the discount rate, rather than the cost of capital (or weighted average cost of capital, WACC) which accounts for debt. In this calculation we've used 19%, which is based on a levered beta of 1.527. Beta is a measure of a stock's volatility, compared to the market as a whole. We get our beta from the industry average beta of globally comparable companies, with an imposed limit between 0.8 and 2.0, which is a reasonable range for a stable business.
SWOT Analysis for Hisar Metal Industries
Strength
- Dividends are covered by earnings and cash flows.
Weakness
- Earnings declined over the past year.
- Interest payments on debt are not well covered.
- Dividend is low compared to the top 25% of dividend payers in the Metals and Mining market.
- Current share price is above our estimate of fair value.
Opportunity
- HISARMETAL's financial characteristics indicate limited near-term opportunities for shareholders.
- Lack of analyst coverage makes it difficult to determine HISARMETAL's earnings prospects.
Threat
- Debt is not well covered by operating cash flow.
Looking Ahead:
Whilst important, the DCF calculation ideally won't be the sole piece of analysis you scrutinize for a company. DCF models are not the be-all and end-all of investment valuation. Instead the best use for a DCF model is to test certain assumptions and theories to see if they would lead to the company being undervalued or overvalued. If a company grows at a different rate, or if its cost of equity or risk free rate changes sharply, the output can look very different. For Hisar Metal Industries, there are three additional items you should explore:
- Risks: For example, we've discovered 3 warning signs for Hisar Metal Industries (1 can't be ignored!) that you should be aware of before investing here.
- Other High Quality Alternatives: Do you like a good all-rounder? Explore our interactive list of high quality stocks to get an idea of what else is out there you may be missing!
- Other Top Analyst Picks: Interested to see what the analysts are thinking? Take a look at our interactive list of analysts' top stock picks to find out what they feel might have an attractive future outlook!
PS. The Simply Wall St app conducts a discounted cash flow valuation for every stock on the NSEI every day. If you want to find the calculation for other stocks just search here.
Valuation is complex, but we're here to simplify it.
Discover if Hisar Metal Industries might be undervalued or overvalued with our detailed analysis, featuring fair value estimates, potential risks, dividends, insider trades, and its financial condition.
Access Free AnalysisHave feedback on this article? Concerned about the content? Get in touch with us directly. Alternatively, email editorial-team (at) simplywallst.com.
This article by Simply Wall St is general in nature. We provide commentary based on historical data and analyst forecasts only using an unbiased methodology and our articles are not intended to be financial advice. It does not constitute a recommendation to buy or sell any stock, and does not take account of your objectives, or your financial situation. We aim to bring you long-term focused analysis driven by fundamental data. Note that our analysis may not factor in the latest price-sensitive company announcements or qualitative material. Simply Wall St has no position in any stocks mentioned.
About NSEI:HISARMETAL
Hisar Metal Industries
Manufactures and sells cold rolled precision stainless steel strips, and stainless steel welded tubes and pipes in India.
Established dividend payer with mediocre balance sheet.
Similar Companies
Market Insights

Advertisement
Community Narratives
Scaling up in building materials with smart M&A and growing profitability
Fair Value US$2.77|29.6% undervalued
CM
Community Contributor
Hims: The Platform Powering Personalised Healthcare
Fair Value US$114.01|49.1% undervalued
BL
Community Contributor
Undervalued lottery company with strong fundamentals
Fair Value AU$15.00|35.8% undervalued
RO
Community Contributor
Proximus, transferring money from the impatient to the patient investor
Fair Value €16.62|55.2% undervalued
AX
Community Contributor