- India
- /
- Metals and Mining
- /
- NSEI:GALLISPAT
What Is Gallantt Ispat's (NSE:GALLISPAT) P/E Ratio After Its Share Price Rocketed?


It's great to see Gallantt Ispat (NSE:GALLISPAT) shareholders have their patience rewarded with a 31% share price pop in the last month. But shareholders may not all be feeling jubilant, since the share price is still down 34% in the last year.
All else being equal, a sharp share price increase should make a stock less attractive to potential investors. While the market sentiment towards a stock is very changeable, in the long run, the share price will tend to move in the same direction as earnings per share. The implication here is that deep value investors might steer clear when expectations of a company are too high. One way to gauge market expectations of a stock is to look at its Price to Earnings Ratio (PE Ratio). A high P/E implies that investors have high expectations of what a company can achieve compared to a company with a low P/E ratio.
View our latest analysis for Gallantt Ispat
How Does Gallantt Ispat's P/E Ratio Compare To Its Peers?
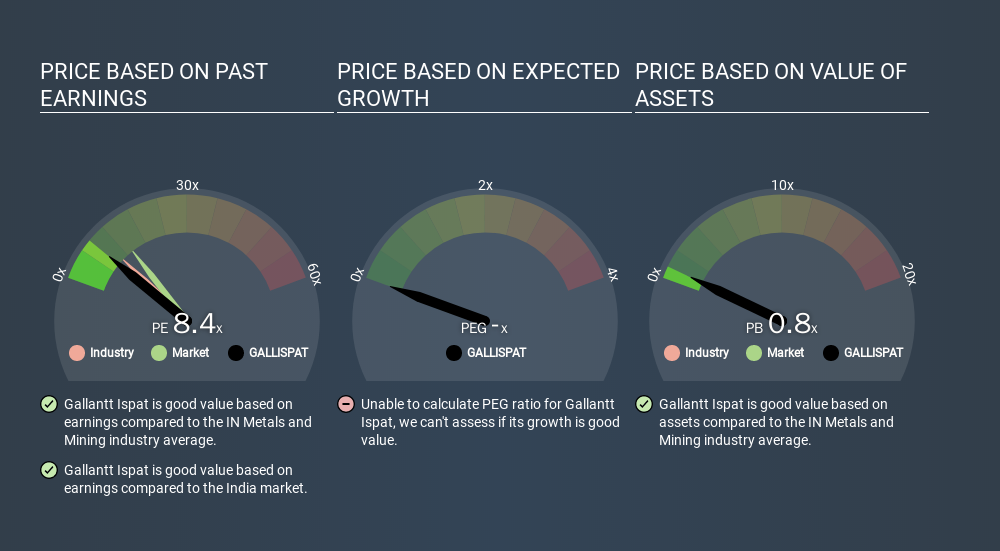
We can tell from its P/E ratio of 8.42 that sentiment around Gallantt Ispat isn't particularly high. The image below shows that Gallantt Ispat has a lower P/E than the average (10.2) P/E for companies in the metals and mining industry.
Its relatively low P/E ratio indicates that Gallantt Ispat shareholders think it will struggle to do as well as other companies in its industry classification. Many investors like to buy stocks when the market is pessimistic about their prospects. You should delve deeper. I like to check if company insiders have been buying or selling.
How Growth Rates Impact P/E Ratios
Probably the most important factor in determining what P/E a company trades on is the earnings growth. That's because companies that grow earnings per share quickly will rapidly increase the 'E' in the equation. That means even if the current P/E is high, it will reduce over time if the share price stays flat. So while a stock may look expensive based on past earnings, it could be cheap based on future earnings.
Gallantt Ispat shrunk earnings per share by 23% over the last year. But EPS is up 39% over the last 5 years.
Remember: P/E Ratios Don't Consider The Balance Sheet
It's important to note that the P/E ratio considers the market capitalization, not the enterprise value. Thus, the metric does not reflect cash or debt held by the company. In theory, a company can lower its future P/E ratio by using cash or debt to invest in growth.
While growth expenditure doesn't always pay off, the point is that it is a good option to have; but one that the P/E ratio ignores.
So What Does Gallantt Ispat's Balance Sheet Tell Us?
The extra options and safety that comes with Gallantt Ispat's ₹59m net cash position means that it deserves a higher P/E than it would if it had a lot of net debt.
The Verdict On Gallantt Ispat's P/E Ratio
Gallantt Ispat trades on a P/E ratio of 8.4, which is below the IN market average of 13.8. The recent drop in earnings per share would make investors cautious, the relatively strong balance sheet will allow the company time to invest in growth. If it achieves that, then there's real potential that the low P/E could eventually indicate undervaluation. What is very clear is that the market has become less pessimistic about Gallantt Ispat over the last month, with the P/E ratio rising from 6.4 back then to 8.4 today. If you like to buy stocks that could be turnaround opportunities, then this one might be a candidate; but if you're more sensitive to price, then you may feel the opportunity has passed.
Investors have an opportunity when market expectations about a stock are wrong. If it is underestimating a company, investors can make money by buying and holding the shares until the market corrects itself. Although we don't have analyst forecasts shareholders might want to examine this detailed historical graph of earnings, revenue and cash flow.
You might be able to find a better buy than Gallantt Ispat. If you want a selection of possible winners, check out this free list of interesting companies that trade on a P/E below 20 (but have proven they can grow earnings).
If you spot an error that warrants correction, please contact the editor at editorial-team@simplywallst.com. This article by Simply Wall St is general in nature. It does not constitute a recommendation to buy or sell any stock, and does not take account of your objectives, or your financial situation. Simply Wall St has no position in the stocks mentioned.
We aim to bring you long-term focused research analysis driven by fundamental data. Note that our analysis may not factor in the latest price-sensitive company announcements or qualitative material. Thank you for reading.
About NSEI:GALLISPAT
Gallantt Ispat
Gallantt Ispat Limited manufactures and sells iron and steel, and agro products under the Gallantt brand name in India.
Flawless balance sheet with acceptable track record.
Similar Companies
Market Insights

Community Narratives


