
Advertisement
Are Deepak Fertilisers And Petrochemicals Corporation Limited (NSE:DEEPAKFERT) Investors Paying Above The Intrinsic Value?
Key Insights
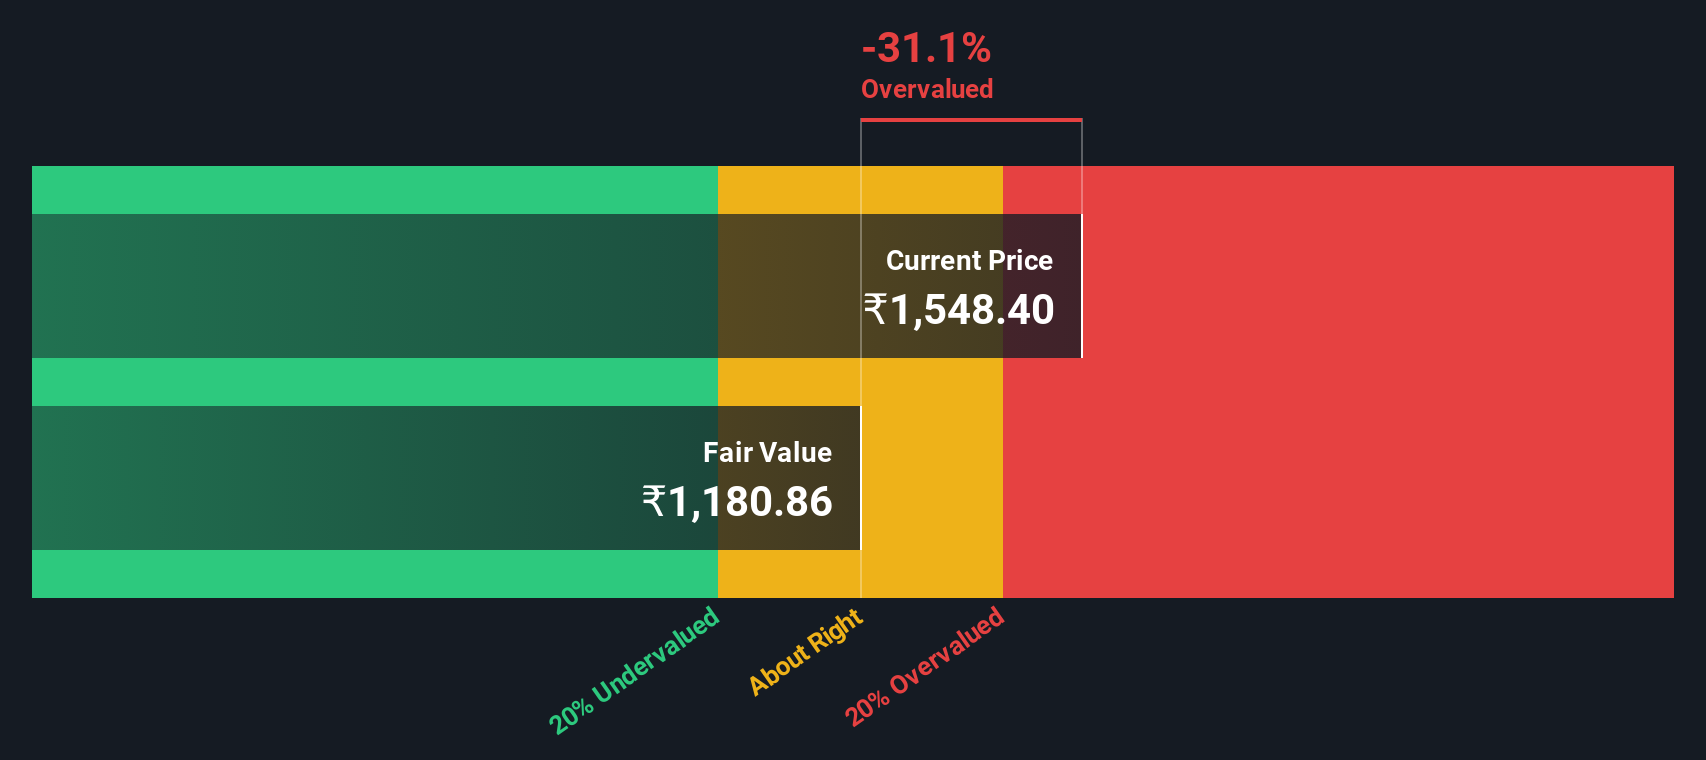
- Deepak Fertilisers And Petrochemicals' estimated fair value is ₹1,181 based on 2 Stage Free Cash Flow to Equity
- Deepak Fertilisers And Petrochemicals is estimated to be 31% overvalued based on current share price of ₹1,548
- When compared to theindustry average discount of -7,799%, Deepak Fertilisers And Petrochemicals' competitors seem to be trading at a greater premium to fair value
In this article we are going to estimate the intrinsic value of Deepak Fertilisers And Petrochemicals Corporation Limited (NSE:DEEPAKFERT) by taking the expected future cash flows and discounting them to today's value. We will use the Discounted Cash Flow (DCF) model on this occasion. Don't get put off by the jargon, the math behind it is actually quite straightforward.
We generally believe that a company's value is the present value of all of the cash it will generate in the future. However, a DCF is just one valuation metric among many, and it is not without flaws. For those who are keen learners of equity analysis, the Simply Wall St analysis model here may be something of interest to you.
Step By Step Through The Calculation
We are going to use a two-stage DCF model, which, as the name states, takes into account two stages of growth. The first stage is generally a higher growth period which levels off heading towards the terminal value, captured in the second 'steady growth' period. To begin with, we have to get estimates of the next ten years of cash flows. Where possible we use analyst estimates, but when these aren't available we extrapolate the previous free cash flow (FCF) from the last estimate or reported value. We assume companies with shrinking free cash flow will slow their rate of shrinkage, and that companies with growing free cash flow will see their growth rate slow, over this period. We do this to reflect that growth tends to slow more in the early years than it does in later years.
A DCF is all about the idea that a dollar in the future is less valuable than a dollar today, so we need to discount the sum of these future cash flows to arrive at a present value estimate:
10-year free cash flow (FCF) estimate
| 2026 | 2027 | 2028 | 2029 | 2030 | 2031 | 2032 | 2033 | 2034 | 2035 | |
| Levered FCF (₹, Millions) | ₹33.5b | ₹12.8b | ₹12.3b | ₹12.3b | ₹12.5b | ₹12.9b | ₹13.5b | ₹14.2b | ₹14.9b | ₹15.8b |
| Growth Rate Estimate Source | Analyst x1 | Analyst x2 | Analyst x1 | Est @ -0.41% | Est @ 1.74% | Est @ 3.24% | Est @ 4.30% | Est @ 5.04% | Est @ 5.55% | Est @ 5.92% |
| Present Value (₹, Millions) Discounted @ 14% | ₹29.4k | ₹9.9k | ₹8.3k | ₹7.3k | ₹6.5k | ₹5.9k | ₹5.4k | ₹5.0k | ₹4.6k | ₹4.3k |
("Est" = FCF growth rate estimated by Simply Wall St)
Present Value of 10-year Cash Flow (PVCF) = ₹86b
After calculating the present value of future cash flows in the initial 10-year period, we need to calculate the Terminal Value, which accounts for all future cash flows beyond the first stage. The Gordon Growth formula is used to calculate Terminal Value at a future annual growth rate equal to the 5-year average of the 10-year government bond yield of 6.8%. We discount the terminal cash flows to today's value at a cost of equity of 14%.
Terminal Value (TV)= FCF2035 × (1 + g) ÷ (r – g) = ₹16b× (1 + 6.8%) ÷ (14%– 6.8%) = ₹233b
Present Value of Terminal Value (PVTV)= TV / (1 + r)10= ₹233b÷ ( 1 + 14%)10= ₹63b
The total value, or equity value, is then the sum of the present value of the future cash flows, which in this case is ₹149b. To get the intrinsic value per share, we divide this by the total number of shares outstanding. Compared to the current share price of ₹1.5k, the company appears potentially overvalued at the time of writing. Remember though, that this is just an approximate valuation, and like any complex formula - garbage in, garbage out.
The Assumptions
Now the most important inputs to a discounted cash flow are the discount rate, and of course, the actual cash flows. If you don't agree with these result, have a go at the calculation yourself and play with the assumptions. The DCF also does not consider the possible cyclicality of an industry, or a company's future capital requirements, so it does not give a full picture of a company's potential performance. Given that we are looking at Deepak Fertilisers And Petrochemicals as potential shareholders, the cost of equity is used as the discount rate, rather than the cost of capital (or weighted average cost of capital, WACC) which accounts for debt. In this calculation we've used 14%, which is based on a levered beta of 0.974. Beta is a measure of a stock's volatility, compared to the market as a whole. We get our beta from the industry average beta of globally comparable companies, with an imposed limit between 0.8 and 2.0, which is a reasonable range for a stable business.
See our latest analysis for Deepak Fertilisers And Petrochemicals
SWOT Analysis for Deepak Fertilisers And Petrochemicals
Strength
- Earnings growth over the past year exceeded the industry.
- Debt is well covered by earnings and cashflows.
- Dividends are covered by earnings and cash flows.
Weakness
- Dividend is low compared to the top 25% of dividend payers in the Chemicals market.
Opportunity
- Annual earnings are forecast to grow for the next 3 years.
- Good value based on P/E ratio compared to estimated Fair P/E ratio.
Threat
- No apparent threats visible for DEEPAKFERT.
Moving On:
Whilst important, the DCF calculation shouldn't be the only metric you look at when researching a company. It's not possible to obtain a foolproof valuation with a DCF model. Preferably you'd apply different cases and assumptions and see how they would impact the company's valuation. For example, changes in the company's cost of equity or the risk free rate can significantly impact the valuation. Why is the intrinsic value lower than the current share price? For Deepak Fertilisers And Petrochemicals, we've compiled three important aspects you should consider:
- Risks: Case in point, we've spotted 2 warning signs for Deepak Fertilisers And Petrochemicals you should be aware of.
- Future Earnings: How does DEEPAKFERT's growth rate compare to its peers and the wider market? Dig deeper into the analyst consensus number for the upcoming years by interacting with our free analyst growth expectation chart.
- Other High Quality Alternatives: Do you like a good all-rounder? Explore our interactive list of high quality stocks to get an idea of what else is out there you may be missing!
PS. Simply Wall St updates its DCF calculation for every Indian stock every day, so if you want to find the intrinsic value of any other stock just search here.
New: Manage All Your Stock Portfolios in One Place
We've created the ultimate portfolio companion for stock investors, and it's free.
• Connect an unlimited number of Portfolios and see your total in one currency
• Be alerted to new Warning Signs or Risks via email or mobile
• Track the Fair Value of your stocks
Have feedback on this article? Concerned about the content? Get in touch with us directly. Alternatively, email editorial-team (at) simplywallst.com.
This article by Simply Wall St is general in nature. We provide commentary based on historical data and analyst forecasts only using an unbiased methodology and our articles are not intended to be financial advice. It does not constitute a recommendation to buy or sell any stock, and does not take account of your objectives, or your financial situation. We aim to bring you long-term focused analysis driven by fundamental data. Note that our analysis may not factor in the latest price-sensitive company announcements or qualitative material. Simply Wall St has no position in any stocks mentioned.
About NSEI:DEEPAKFERT
Deepak Fertilisers And Petrochemicals
Engages in the manufacture, trade, and sale of bulk chemicals in India.
Solid track record with excellent balance sheet and pays a dividend.
Market Insights

Advertisement
Community Narratives
A formidable player in AI and enterprise computing.
Fair Value US$210.00|13.6% overvalued
CO
Community Contributor
IREN's Bold Moves in Sustainable Bitcoin Mining & AI Data Centers
Fair Value US$89.00|23.6% undervalued
BL
Community Contributor
Cooling the Champions: The Aussie Tech Behind F1's Victories
Fair Value AU$12.40|40.6% undervalued
TR
Community Contributor