
Advertisement
- India
- /
- Metals and Mining
- /
- NSEI:BEDMUTHA
We Like These Underlying Return On Capital Trends At Bedmutha Industries (NSE:BEDMUTHA)
What trends should we look for it we want to identify stocks that can multiply in value over the long term? Firstly, we'd want to identify a growing return on capital employed (ROCE) and then alongside that, an ever-increasing base of capital employed. This shows us that it's a compounding machine, able to continually reinvest its earnings back into the business and generate higher returns. Speaking of which, we noticed some great changes in Bedmutha Industries' (NSE:BEDMUTHA) returns on capital, so let's have a look.
What Is Return On Capital Employed (ROCE)?
For those that aren't sure what ROCE is, it measures the amount of pre-tax profits a company can generate from the capital employed in its business. Analysts use this formula to calculate it for Bedmutha Industries:
Return on Capital Employed = Earnings Before Interest and Tax (EBIT) ÷ (Total Assets - Current Liabilities)
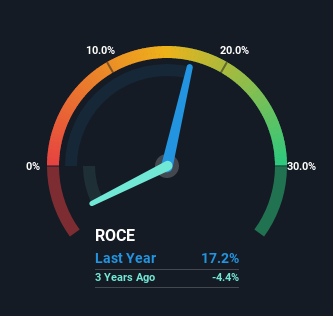
0.17 = ₹483m ÷ (₹4.9b - ₹2.1b) (Based on the trailing twelve months to June 2022).
Thus, Bedmutha Industries has an ROCE of 17%. By itself that's a normal return on capital and it's in line with the industry's average returns of 17%.
Our analysis indicates that BEDMUTHA is potentially undervalued!
While the past is not representative of the future, it can be helpful to know how a company has performed historically, which is why we have this chart above. If you're interested in investigating Bedmutha Industries' past further, check out this free graph of past earnings, revenue and cash flow.
What Does the ROCE Trend For Bedmutha Industries Tell Us?
Bedmutha Industries is showing promise given that its ROCE is trending up and to the right. The figures show that over the last five years, ROCE has grown 1,239% whilst employing roughly the same amount of capital. So our take on this is that the business has increased efficiencies to generate these higher returns, all the while not needing to make any additional investments. The company is doing well in that sense, and it's worth investigating what the management team has planned for long term growth prospects.
On a side note, Bedmutha Industries' current liabilities are still rather high at 43% of total assets. This can bring about some risks because the company is basically operating with a rather large reliance on its suppliers or other sorts of short-term creditors. While it's not necessarily a bad thing, it can be beneficial if this ratio is lower.
The Bottom Line
In summary, we're delighted to see that Bedmutha Industries has been able to increase efficiencies and earn higher rates of return on the same amount of capital. And with the stock having performed exceptionally well over the last five years, these patterns are being accounted for by investors. In light of that, we think it's worth looking further into this stock because if Bedmutha Industries can keep these trends up, it could have a bright future ahead.
Since virtually every company faces some risks, it's worth knowing what they are, and we've spotted 3 warning signs for Bedmutha Industries (of which 1 makes us a bit uncomfortable!) that you should know about.
If you want to search for solid companies with great earnings, check out this free list of companies with good balance sheets and impressive returns on equity.
Valuation is complex, but we're here to simplify it.
Discover if Bedmutha Industries might be undervalued or overvalued with our detailed analysis, featuring fair value estimates, potential risks, dividends, insider trades, and its financial condition.
Access Free AnalysisHave feedback on this article? Concerned about the content? Get in touch with us directly. Alternatively, email editorial-team (at) simplywallst.com.
This article by Simply Wall St is general in nature. We provide commentary based on historical data and analyst forecasts only using an unbiased methodology and our articles are not intended to be financial advice. It does not constitute a recommendation to buy or sell any stock, and does not take account of your objectives, or your financial situation. We aim to bring you long-term focused analysis driven by fundamental data. Note that our analysis may not factor in the latest price-sensitive company announcements or qualitative material. Simply Wall St has no position in any stocks mentioned.
About NSEI:BEDMUTHA
Bedmutha Industries
Engages in the manufacture and export of steel wire and wire products in India.
Adequate balance sheet with low risk.
Similar Companies
Market Insights

Advertisement
Community Narratives
America Wants Homegrown Drones — Draganfly Is Ready to Deliver
Fair Value US$9.21|33.8% undervalued
JO
Community Contributor
Cheesecake Factory offers an enticing opportunity for long-term growth by leveraging new concepts
Fair Value US$73.83|26.3% undervalued
ZW
Community Contributor
Coca-Cola’s Intrinsic Value Set to Rise with Fed Rate Cut
Fair Value US$67.50|1.2% undervalued
AL
Community Contributor
Fully Permitted Gold Mine with 50 Baggers Potential 
Fair Value CA$41.00|98.6% undervalued
RO
Community Contributor