Some Investors May Be Worried About Ambica Agarbathies Aroma & Industries' (NSE:AMBICAAGAR) Returns On Capital


What trends should we look for it we want to identify stocks that can multiply in value over the long term? Typically, we'll want to notice a trend of growing return on capital employed (ROCE) and alongside that, an expanding base of capital employed. If you see this, it typically means it's a company with a great business model and plenty of profitable reinvestment opportunities. Although, when we looked at Ambica Agarbathies Aroma & Industries (NSE:AMBICAAGAR), it didn't seem to tick all of these boxes.
What is Return On Capital Employed (ROCE)?
For those that aren't sure what ROCE is, it measures the amount of pre-tax profits a company can generate from the capital employed in its business. The formula for this calculation on Ambica Agarbathies Aroma & Industries is:
Return on Capital Employed = Earnings Before Interest and Tax (EBIT) ÷ (Total Assets - Current Liabilities)
0.011 = ₹21m ÷ (₹2.0b - ₹88m) (Based on the trailing twelve months to December 2021).
So, Ambica Agarbathies Aroma & Industries has an ROCE of 1.1%. Ultimately, that's a low return and it under-performs the Chemicals industry average of 18%.
View our latest analysis for Ambica Agarbathies Aroma & Industries
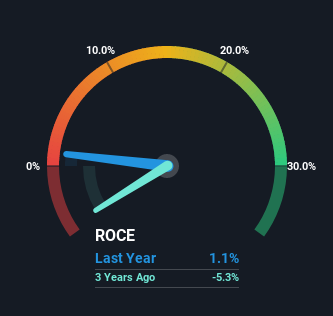
Historical performance is a great place to start when researching a stock so above you can see the gauge for Ambica Agarbathies Aroma & Industries' ROCE against it's prior returns. If you'd like to look at how Ambica Agarbathies Aroma & Industries has performed in the past in other metrics, you can view this free graph of past earnings, revenue and cash flow.
What Can We Tell From Ambica Agarbathies Aroma & Industries' ROCE Trend?
On the surface, the trend of ROCE at Ambica Agarbathies Aroma & Industries doesn't inspire confidence. Over the last five years, returns on capital have decreased to 1.1% from 13% five years ago. And considering revenue has dropped while employing more capital, we'd be cautious. If this were to continue, you might be looking at a company that is trying to reinvest for growth but is actually losing market share since sales haven't increased.
On a related note, Ambica Agarbathies Aroma & Industries has decreased its current liabilities to 4.4% of total assets. So we could link some of this to the decrease in ROCE. What's more, this can reduce some aspects of risk to the business because now the company's suppliers or short-term creditors are funding less of its operations. Since the business is basically funding more of its operations with it's own money, you could argue this has made the business less efficient at generating ROCE.
Our Take On Ambica Agarbathies Aroma & Industries' ROCE
We're a bit apprehensive about Ambica Agarbathies Aroma & Industries because despite more capital being deployed in the business, returns on that capital and sales have both fallen. Investors haven't taken kindly to these developments, since the stock has declined 16% from where it was year ago. That being the case, unless the underlying trends revert to a more positive trajectory, we'd consider looking elsewhere.
If you'd like to know more about Ambica Agarbathies Aroma & Industries, we've spotted 3 warning signs, and 2 of them are significant.
While Ambica Agarbathies Aroma & Industries isn't earning the highest return, check out this free list of companies that are earning high returns on equity with solid balance sheets.
If you're looking to trade Ambica Agarbathies Aroma & Industries, open an account with the lowest-cost platform trusted by professionals, Interactive Brokers.
With clients in over 200 countries and territories, and access to 160 markets, IBKR lets you trade stocks, options, futures, forex, bonds and funds from a single integrated account.
Enjoy no hidden fees, no account minimums, and FX conversion rates as low as 0.03%, far better than what most brokers offer.
Sponsored ContentNew: Manage All Your Stock Portfolios in One Place
We've created the ultimate portfolio companion for stock investors, and it's free.
• Connect an unlimited number of Portfolios and see your total in one currency
• Be alerted to new Warning Signs or Risks via email or mobile
• Track the Fair Value of your stocks
Have feedback on this article? Concerned about the content? Get in touch with us directly. Alternatively, email editorial-team (at) simplywallst.com.
This article by Simply Wall St is general in nature. We provide commentary based on historical data and analyst forecasts only using an unbiased methodology and our articles are not intended to be financial advice. It does not constitute a recommendation to buy or sell any stock, and does not take account of your objectives, or your financial situation. We aim to bring you long-term focused analysis driven by fundamental data. Note that our analysis may not factor in the latest price-sensitive company announcements or qualitative material. Simply Wall St has no position in any stocks mentioned.
About NSEI:AMBICAAGAR
Ambica Agarbathies Aroma & Industries
Engages in the manufacture and sale of incense sticks in India and internationally.
Low and slightly overvalued.
Market Insights

Community Narratives


