Could The Market Be Wrong About Star Health and Allied Insurance Company Limited (NSE:STARHEALTH) Given Its Attractive Financial Prospects?


It is hard to get excited after looking at Star Health and Allied Insurance's (NSE:STARHEALTH) recent performance, when its stock has declined 16% over the past three months. But if you pay close attention, you might gather that its strong financials could mean that the stock could potentially see an increase in value in the long-term, given how markets usually reward companies with good financial health. Specifically, we decided to study Star Health and Allied Insurance's ROE in this article.
Return on equity or ROE is an important factor to be considered by a shareholder because it tells them how effectively their capital is being reinvested. In simpler terms, it measures the profitability of a company in relation to shareholder's equity.
View our latest analysis for Star Health and Allied Insurance
How Do You Calculate Return On Equity?
ROE can be calculated by using the formula:
Return on Equity = Net Profit (from continuing operations) ÷ Shareholders' Equity
So, based on the above formula, the ROE for Star Health and Allied Insurance is:
11% = ₹7.9b ÷ ₹70b (Based on the trailing twelve months to December 2024).
The 'return' is the yearly profit. So, this means that for every ₹1 of its shareholder's investments, the company generates a profit of ₹0.11.
Why Is ROE Important For Earnings Growth?
We have already established that ROE serves as an efficient profit-generating gauge for a company's future earnings. We now need to evaluate how much profit the company reinvests or "retains" for future growth which then gives us an idea about the growth potential of the company. Assuming everything else remains unchanged, the higher the ROE and profit retention, the higher the growth rate of a company compared to companies that don't necessarily bear these characteristics.
Star Health and Allied Insurance's Earnings Growth And 11% ROE
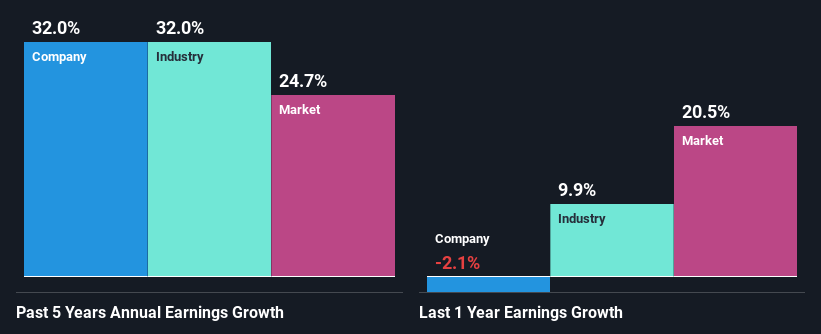
On the face of it, Star Health and Allied Insurance's ROE is not much to talk about. However, the fact that the company's ROE is higher than the average industry ROE of 8.3%, is definitely interesting. Particularly, the substantial 32% net income growth seen by Star Health and Allied Insurance over the past five years is impressive . That being said, the company does have a slightly low ROE to begin with, just that it is higher than the industry average. Hence, there might be some other aspects that are causing earnings to grow. E.g the company has a low payout ratio or could belong to a high growth industry.
We then performed a comparison between Star Health and Allied Insurance's net income growth with the industry, which revealed that the company's growth is similar to the average industry growth of 32% in the same 5-year period.
Earnings growth is an important metric to consider when valuing a stock. The investor should try to establish if the expected growth or decline in earnings, whichever the case may be, is priced in. This then helps them determine if the stock is placed for a bright or bleak future. Is Star Health and Allied Insurance fairly valued compared to other companies? These 3 valuation measures might help you decide.
Is Star Health and Allied Insurance Efficiently Re-investing Its Profits?
Star Health and Allied Insurance doesn't pay any regular dividends to its shareholders, meaning that the company has been reinvesting all of its profits into the business. This is likely what's driving the high earnings growth number discussed above.
Conclusion
Overall, we are quite pleased with Star Health and Allied Insurance's performance. In particular, it's great to see that the company has seen significant growth in its earnings backed by a respectable ROE and a high reinvestment rate. Having said that, the company's earnings growth is expected to slow down, as forecasted in the current analyst estimates. To know more about the latest analysts predictions for the company, check out this visualization of analyst forecasts for the company.
New: Manage All Your Stock Portfolios in One Place
We've created the ultimate portfolio companion for stock investors, and it's free.
• Connect an unlimited number of Portfolios and see your total in one currency
• Be alerted to new Warning Signs or Risks via email or mobile
• Track the Fair Value of your stocks
Have feedback on this article? Concerned about the content? Get in touch with us directly. Alternatively, email editorial-team (at) simplywallst.com.
This article by Simply Wall St is general in nature. We provide commentary based on historical data and analyst forecasts only using an unbiased methodology and our articles are not intended to be financial advice. It does not constitute a recommendation to buy or sell any stock, and does not take account of your objectives, or your financial situation. We aim to bring you long-term focused analysis driven by fundamental data. Note that our analysis may not factor in the latest price-sensitive company announcements or qualitative material. Simply Wall St has no position in any stocks mentioned.
About NSEI:STARHEALTH
Star Health and Allied Insurance
Provides health insurance products in India.
Excellent balance sheet with reasonable growth potential.
Market Insights

Community Narratives

