
Advertisement
New India Assurance's (NSE:NIACL) three-year total shareholder returns outpace the underlying earnings growth
The most you can lose on any stock (assuming you don't use leverage) is 100% of your money. But if you buy shares in a really great company, you can more than double your money. For instance the The New India Assurance Company Limited (NSE:NIACL) share price is 119% higher than it was three years ago. That sort of return is as solid as granite. It's down 3.1% in the last seven days.
While the stock has fallen 3.1% this week, it's worth focusing on the longer term and seeing if the stocks historical returns have been driven by the underlying fundamentals.
While the efficient markets hypothesis continues to be taught by some, it has been proven that markets are over-reactive dynamic systems, and investors are not always rational. One imperfect but simple way to consider how the market perception of a company has shifted is to compare the change in the earnings per share (EPS) with the share price movement.
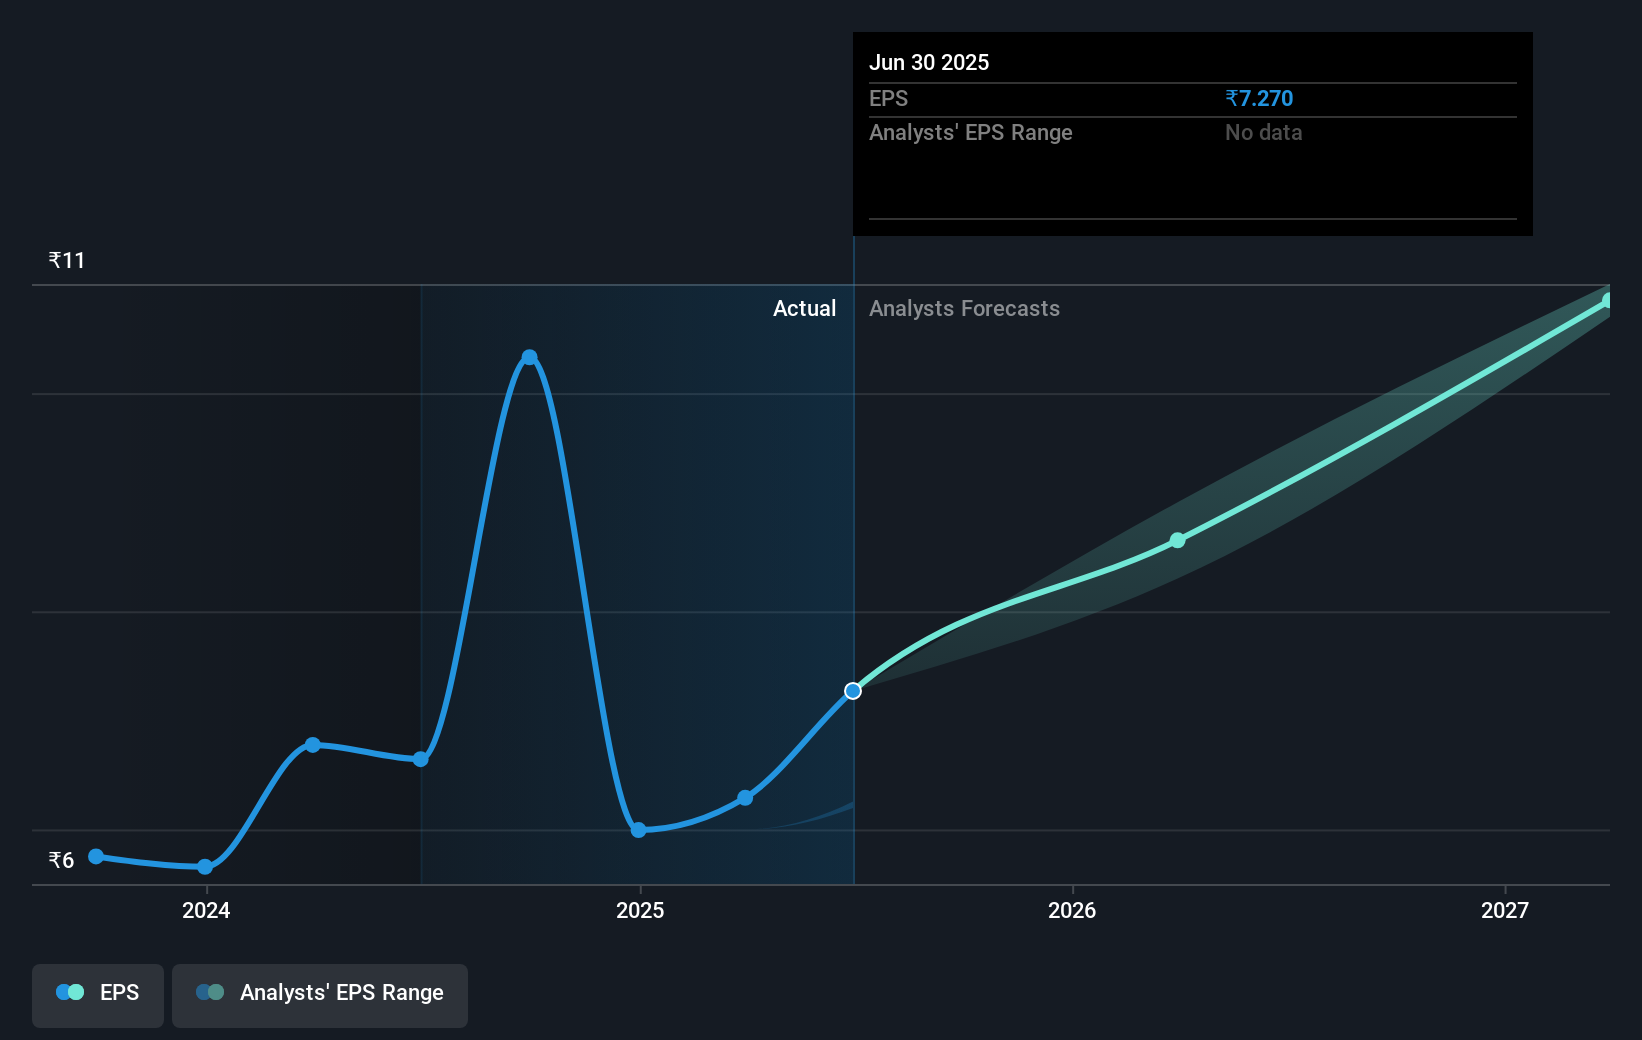
New India Assurance was able to grow its EPS at 73% per year over three years, sending the share price higher. The average annual share price increase of 30% is actually lower than the EPS growth. So one could reasonably conclude that the market has cooled on the stock.
The image below shows how EPS has tracked over time (if you click on the image you can see greater detail).
It is of course excellent to see how New India Assurance has grown profits over the years, but the future is more important for shareholders. You can see how its balance sheet has strengthened (or weakened) over time in this free interactive graphic.
What About Dividends?
It is important to consider the total shareholder return, as well as the share price return, for any given stock. The TSR incorporates the value of any spin-offs or discounted capital raisings, along with any dividends, based on the assumption that the dividends are reinvested. It's fair to say that the TSR gives a more complete picture for stocks that pay a dividend. We note that for New India Assurance the TSR over the last 3 years was 126%, which is better than the share price return mentioned above. This is largely a result of its dividend payments!
A Different Perspective
We regret to report that New India Assurance shareholders are down 9.9% for the year (even including dividends). Unfortunately, that's worse than the broader market decline of 1.1%. However, it could simply be that the share price has been impacted by broader market jitters. It might be worth keeping an eye on the fundamentals, in case there's a good opportunity. On the bright side, long term shareholders have made money, with a gain of 14% per year over half a decade. It could be that the recent sell-off is an opportunity, so it may be worth checking the fundamental data for signs of a long term growth trend. While it is well worth considering the different impacts that market conditions can have on the share price, there are other factors that are even more important. To that end, you should be aware of the 1 warning sign we've spotted with New India Assurance .
If you like to buy stocks alongside management, then you might just love this free list of companies. (Hint: many of them are unnoticed AND have attractive valuation).
Please note, the market returns quoted in this article reflect the market weighted average returns of stocks that currently trade on Indian exchanges.
Valuation is complex, but we're here to simplify it.
Discover if New India Assurance might be undervalued or overvalued with our detailed analysis, featuring fair value estimates, potential risks, dividends, insider trades, and its financial condition.
Access Free AnalysisHave feedback on this article? Concerned about the content? Get in touch with us directly. Alternatively, email editorial-team (at) simplywallst.com.
This article by Simply Wall St is general in nature. We provide commentary based on historical data and analyst forecasts only using an unbiased methodology and our articles are not intended to be financial advice. It does not constitute a recommendation to buy or sell any stock, and does not take account of your objectives, or your financial situation. We aim to bring you long-term focused analysis driven by fundamental data. Note that our analysis may not factor in the latest price-sensitive company announcements or qualitative material. Simply Wall St has no position in any stocks mentioned.
About NSEI:NIACL
New India Assurance
Operates as a general insurance company in India and internationally.
Excellent balance sheet with moderate growth potential.
Market Insights

Advertisement
Community Narratives
Kodiak AI - a potential 100 bagger opportunity?
Fair Value US$14.00|44.7% undervalued
DA
Community Contributor
A Fair Price for a Great Business Facing Real Threats
Fair Value US$383.06|13.0% undervalued
IM
Community Contributor
AXON And Shopify Integration Will Unlock Global Mobile Advertising
Fair Value US$646.30|0% overvalued
AN
Based on Analyst Price Targets