
Advertisement
- India
- /
- Personal Products
- /
- NSEI:JHS
JHS Svendgaard Laboratories Limited (NSE:JHS) Not Doing Enough For Some Investors As Its Shares Slump 33%
JHS Svendgaard Laboratories Limited (NSE:JHS) shares have had a horrible month, losing 33% after a relatively good period beforehand. Still, a bad month hasn't completely ruined the past year with the stock gaining 25%, which is great even in a bull market.
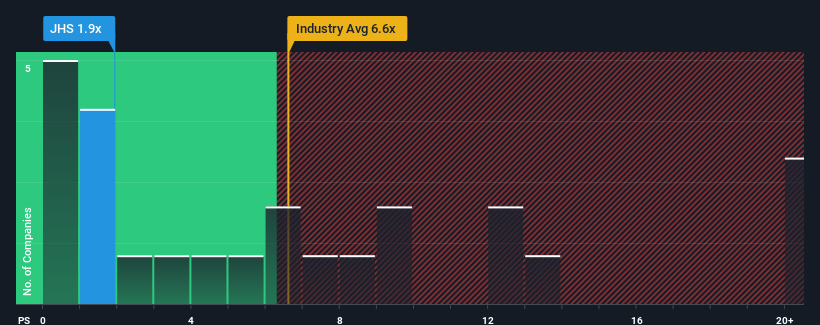
Following the heavy fall in price, JHS Svendgaard Laboratories may be sending very bullish signals at the moment with its price-to-sales (or "P/S") ratio of 1.9x, since almost half of all companies in the Personal Products industry in India have P/S ratios greater than 6.6x and even P/S higher than 11x are not unusual. Although, it's not wise to just take the P/S at face value as there may be an explanation why it's so limited.
View our latest analysis for JHS Svendgaard Laboratories
How Has JHS Svendgaard Laboratories Performed Recently?
As an illustration, revenue has deteriorated at JHS Svendgaard Laboratories over the last year, which is not ideal at all. It might be that many expect the disappointing revenue performance to continue or accelerate, which has repressed the P/S. If you like the company, you'd be hoping this isn't the case so that you could potentially pick up some stock while it's out of favour.
Although there are no analyst estimates available for JHS Svendgaard Laboratories, take a look at this free data-rich visualisation to see how the company stacks up on earnings, revenue and cash flow.How Is JHS Svendgaard Laboratories' Revenue Growth Trending?
In order to justify its P/S ratio, JHS Svendgaard Laboratories would need to produce anemic growth that's substantially trailing the industry.
In reviewing the last year of financials, we were disheartened to see the company's revenues fell to the tune of 2.8%. The last three years don't look nice either as the company has shrunk revenue by 27% in aggregate. Therefore, it's fair to say the revenue growth recently has been undesirable for the company.
Comparing that to the industry, which is predicted to deliver 6.7% growth in the next 12 months, the company's downward momentum based on recent medium-term revenue results is a sobering picture.
With this in mind, we understand why JHS Svendgaard Laboratories' P/S is lower than most of its industry peers. However, we think shrinking revenues are unlikely to lead to a stable P/S over the longer term, which could set up shareholders for future disappointment. Even just maintaining these prices could be difficult to achieve as recent revenue trends are already weighing down the shares.
The Bottom Line On JHS Svendgaard Laboratories' P/S
Shares in JHS Svendgaard Laboratories have plummeted and its P/S has followed suit. It's argued the price-to-sales ratio is an inferior measure of value within certain industries, but it can be a powerful business sentiment indicator.
It's no surprise that JHS Svendgaard Laboratories maintains its low P/S off the back of its sliding revenue over the medium-term. At this stage investors feel the potential for an improvement in revenue isn't great enough to justify a higher P/S ratio. If recent medium-term revenue trends continue, it's hard to see the share price moving strongly in either direction in the near future under these circumstances.
And what about other risks? Every company has them, and we've spotted 5 warning signs for JHS Svendgaard Laboratories (of which 3 shouldn't be ignored!) you should know about.
Of course, profitable companies with a history of great earnings growth are generally safer bets. So you may wish to see this free collection of other companies that have reasonable P/E ratios and have grown earnings strongly.
New: Manage All Your Stock Portfolios in One Place
We've created the ultimate portfolio companion for stock investors, and it's free.
• Connect an unlimited number of Portfolios and see your total in one currency
• Be alerted to new Warning Signs or Risks via email or mobile
• Track the Fair Value of your stocks
Have feedback on this article? Concerned about the content? Get in touch with us directly. Alternatively, email editorial-team (at) simplywallst.com.
This article by Simply Wall St is general in nature. We provide commentary based on historical data and analyst forecasts only using an unbiased methodology and our articles are not intended to be financial advice. It does not constitute a recommendation to buy or sell any stock, and does not take account of your objectives, or your financial situation. We aim to bring you long-term focused analysis driven by fundamental data. Note that our analysis may not factor in the latest price-sensitive company announcements or qualitative material. Simply Wall St has no position in any stocks mentioned.
About NSEI:JHS
JHS Svendgaard Laboratories
Manufactures, trades in, and sells a range of oral and dental products in India.
Excellent balance sheet with slight risk.
Market Insights

Advertisement
Community Narratives
A formidable player in AI and enterprise computing.
Fair Value US$210.00|13.6% overvalued
CO
Community Contributor
IREN's Bold Moves in Sustainable Bitcoin Mining & AI Data Centers
Fair Value US$89.00|23.6% undervalued
BL
Community Contributor
Cooling the Champions: The Aussie Tech Behind F1's Victories
Fair Value AU$12.40|40.6% undervalued
TR
Community Contributor