Zydus Wellness' (NSE:ZYDUSWELL) 7.5% CAGR outpaced the company's earnings growth over the same five-year period


The main point of investing for the long term is to make money. But more than that, you probably want to see it rise more than the market average. But Zydus Wellness Limited (NSE:ZYDUSWELL) has fallen short of that second goal, with a share price rise of 42% over five years, which is below the market return. Some buyers are laughing, though, with an increase of 40% in the last year.
On the back of a solid 7-day performance, let's check what role the company's fundamentals have played in driving long term shareholder returns.
See our latest analysis for Zydus Wellness
In his essay The Superinvestors of Graham-and-Doddsville Warren Buffett described how share prices do not always rationally reflect the value of a business. One flawed but reasonable way to assess how sentiment around a company has changed is to compare the earnings per share (EPS) with the share price.
Over half a decade, Zydus Wellness managed to grow its earnings per share at 0.005% a year. This EPS growth is lower than the 7% average annual increase in the share price. This suggests that market participants hold the company in higher regard, these days. That's not necessarily surprising considering the five-year track record of earnings growth. This favorable sentiment is reflected in its (fairly optimistic) P/E ratio of 48.38.
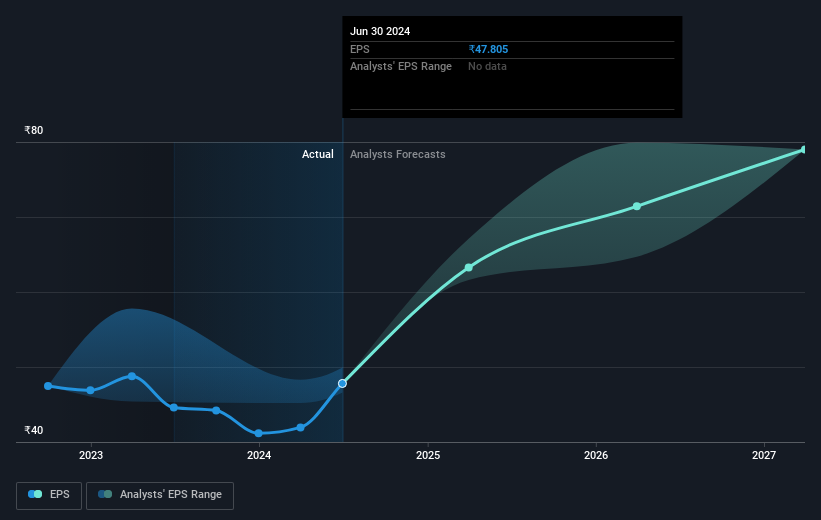
You can see below how EPS has changed over time (discover the exact values by clicking on the image).
We consider it positive that insiders have made significant purchases in the last year. Having said that, most people consider earnings and revenue growth trends to be a more meaningful guide to the business. Dive deeper into the earnings by checking this interactive graph of Zydus Wellness' earnings, revenue and cash flow.
What About Dividends?
It is important to consider the total shareholder return, as well as the share price return, for any given stock. The TSR incorporates the value of any spin-offs or discounted capital raisings, along with any dividends, based on the assumption that the dividends are reinvested. So for companies that pay a generous dividend, the TSR is often a lot higher than the share price return. As it happens, Zydus Wellness' TSR for the last 5 years was 44%, which exceeds the share price return mentioned earlier. And there's no prize for guessing that the dividend payments largely explain the divergence!
A Different Perspective
Zydus Wellness shareholders are up 41% for the year (even including dividends). But that was short of the market average. The silver lining is that the gain was actually better than the average annual return of 8% per year over five year. This could indicate that the company is winning over new investors, as it pursues its strategy. If you want to research this stock further, the data on insider buying is an obvious place to start. You can click here to see who has been buying shares - and the price they paid.
Zydus Wellness is not the only stock insiders are buying. So take a peek at this free list of small cap companies at attractive valuations which insiders have been buying.
Please note, the market returns quoted in this article reflect the market weighted average returns of stocks that currently trade on Indian exchanges.
Valuation is complex, but we're here to simplify it.
Discover if Zydus Wellness might be undervalued or overvalued with our detailed analysis, featuring fair value estimates, potential risks, dividends, insider trades, and its financial condition.
Access Free AnalysisHave feedback on this article? Concerned about the content? Get in touch with us directly. Alternatively, email editorial-team (at) simplywallst.com.
This article by Simply Wall St is general in nature. We provide commentary based on historical data and analyst forecasts only using an unbiased methodology and our articles are not intended to be financial advice. It does not constitute a recommendation to buy or sell any stock, and does not take account of your objectives, or your financial situation. We aim to bring you long-term focused analysis driven by fundamental data. Note that our analysis may not factor in the latest price-sensitive company announcements or qualitative material. Simply Wall St has no position in any stocks mentioned.
About NSEI:ZYDUSWELL
Zydus Wellness
Engages in the development, production, marketing, and distribution of health and wellness products in India.
Flawless balance sheet with solid track record.
Similar Companies
Market Insights

Community Narratives

