
Advertisement
A Look At The Intrinsic Value Of Kaveri Seed Company Limited (NSE:KSCL)
Key Insights
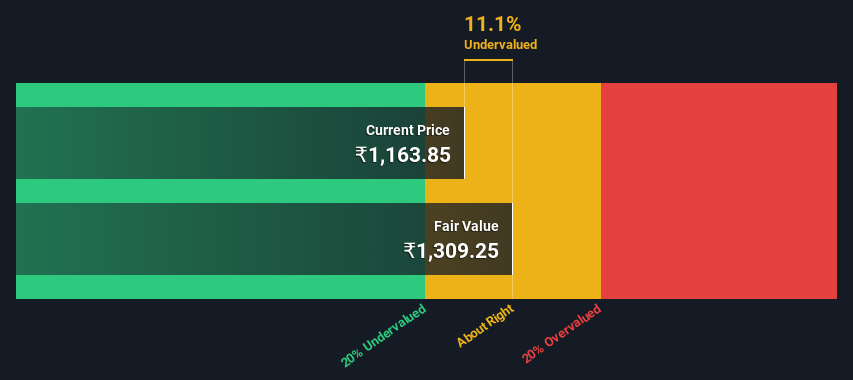
- Using the 2 Stage Free Cash Flow to Equity, Kaveri Seed fair value estimate is ₹1,309
- Kaveri Seed's ₹1,164 share price indicates it is trading at similar levels as its fair value estimate
- Kaveri Seed's peers are currently trading at a premium of 481% on average
Does the September share price for Kaveri Seed Company Limited (NSE:KSCL) reflect what it's really worth? Today, we will estimate the stock's intrinsic value by projecting its future cash flows and then discounting them to today's value. We will use the Discounted Cash Flow (DCF) model on this occasion. Believe it or not, it's not too difficult to follow, as you'll see from our example!
Remember though, that there are many ways to estimate a company's value, and a DCF is just one method. For those who are keen learners of equity analysis, the Simply Wall St analysis model here may be something of interest to you.
View our latest analysis for Kaveri Seed
Step By Step Through The Calculation
We're using the 2-stage growth model, which simply means we take in account two stages of company's growth. In the initial period the company may have a higher growth rate and the second stage is usually assumed to have a stable growth rate. To start off with, we need to estimate the next ten years of cash flows. Where possible we use analyst estimates, but when these aren't available we extrapolate the previous free cash flow (FCF) from the last estimate or reported value. We assume companies with shrinking free cash flow will slow their rate of shrinkage, and that companies with growing free cash flow will see their growth rate slow, over this period. We do this to reflect that growth tends to slow more in the early years than it does in later years.
A DCF is all about the idea that a dollar in the future is less valuable than a dollar today, and so the sum of these future cash flows is then discounted to today's value:
10-year free cash flow (FCF) forecast
| 2025 | 2026 | 2027 | 2028 | 2029 | 2030 | 2031 | 2032 | 2033 | 2034 | |
| Levered FCF (₹, Millions) | ₹2.59b | ₹2.77b | ₹3.60b | ₹4.10b | ₹4.58b | ₹5.05b | ₹5.51b | ₹5.97b | ₹6.44b | ₹6.93b |
| Growth Rate Estimate Source | Analyst x2 | Analyst x2 | Analyst x1 | Est @ 13.83% | Est @ 11.69% | Est @ 10.19% | Est @ 9.15% | Est @ 8.41% | Est @ 7.90% | Est @ 7.54% |
| Present Value (₹, Millions) Discounted @ 12% | ₹2.3k | ₹2.2k | ₹2.6k | ₹2.6k | ₹2.6k | ₹2.5k | ₹2.5k | ₹2.4k | ₹2.3k | ₹2.2k |
("Est" = FCF growth rate estimated by Simply Wall St)
Present Value of 10-year Cash Flow (PVCF) = ₹24b
After calculating the present value of future cash flows in the initial 10-year period, we need to calculate the Terminal Value, which accounts for all future cash flows beyond the first stage. For a number of reasons a very conservative growth rate is used that cannot exceed that of a country's GDP growth. In this case we have used the 5-year average of the 10-year government bond yield (6.7%) to estimate future growth. In the same way as with the 10-year 'growth' period, we discount future cash flows to today's value, using a cost of equity of 12%.
Terminal Value (TV)= FCF2034 × (1 + g) ÷ (r – g) = ₹6.9b× (1 + 6.7%) ÷ (12%– 6.7%) = ₹136b
Present Value of Terminal Value (PVTV)= TV / (1 + r)10= ₹136b÷ ( 1 + 12%)10= ₹43b
The total value is the sum of cash flows for the next ten years plus the discounted terminal value, which results in the Total Equity Value, which in this case is ₹67b. The last step is to then divide the equity value by the number of shares outstanding. Relative to the current share price of ₹1.2k, the company appears about fair value at a 11% discount to where the stock price trades currently. Remember though, that this is just an approximate valuation, and like any complex formula - garbage in, garbage out.
Important Assumptions
Now the most important inputs to a discounted cash flow are the discount rate, and of course, the actual cash flows. Part of investing is coming up with your own evaluation of a company's future performance, so try the calculation yourself and check your own assumptions. The DCF also does not consider the possible cyclicality of an industry, or a company's future capital requirements, so it does not give a full picture of a company's potential performance. Given that we are looking at Kaveri Seed as potential shareholders, the cost of equity is used as the discount rate, rather than the cost of capital (or weighted average cost of capital, WACC) which accounts for debt. In this calculation we've used 12%, which is based on a levered beta of 0.800. Beta is a measure of a stock's volatility, compared to the market as a whole. We get our beta from the industry average beta of globally comparable companies, with an imposed limit between 0.8 and 2.0, which is a reasonable range for a stable business.
SWOT Analysis for Kaveri Seed
Strength
- Earnings growth over the past year exceeded its 5-year average.
- Debt is not viewed as a risk.
- Dividends are covered by earnings and cash flows.
Weakness
- Earnings growth over the past year underperformed the Food industry.
- Dividend is low compared to the top 25% of dividend payers in the Food market.
Opportunity
- Annual earnings are forecast to grow for the next 3 years.
- Good value based on P/E ratio and estimated fair value.
Threat
- No apparent threats visible for KSCL.
Moving On:
Whilst important, the DCF calculation shouldn't be the only metric you look at when researching a company. It's not possible to obtain a foolproof valuation with a DCF model. Preferably you'd apply different cases and assumptions and see how they would impact the company's valuation. For instance, if the terminal value growth rate is adjusted slightly, it can dramatically alter the overall result. For Kaveri Seed, we've compiled three essential factors you should further examine:
- Risks: Case in point, we've spotted 1 warning sign for Kaveri Seed you should be aware of.
- Future Earnings: How does KSCL's growth rate compare to its peers and the wider market? Dig deeper into the analyst consensus number for the upcoming years by interacting with our free analyst growth expectation chart.
- Other High Quality Alternatives: Do you like a good all-rounder? Explore our interactive list of high quality stocks to get an idea of what else is out there you may be missing!
PS. The Simply Wall St app conducts a discounted cash flow valuation for every stock on the NSEI every day. If you want to find the calculation for other stocks just search here.
Valuation is complex, but we're here to simplify it.
Discover if Kaveri Seed might be undervalued or overvalued with our detailed analysis, featuring fair value estimates, potential risks, dividends, insider trades, and its financial condition.
Access Free AnalysisHave feedback on this article? Concerned about the content? Get in touch with us directly. Alternatively, email editorial-team (at) simplywallst.com.
This article by Simply Wall St is general in nature. We provide commentary based on historical data and analyst forecasts only using an unbiased methodology and our articles are not intended to be financial advice. It does not constitute a recommendation to buy or sell any stock, and does not take account of your objectives, or your financial situation. We aim to bring you long-term focused analysis driven by fundamental data. Note that our analysis may not factor in the latest price-sensitive company announcements or qualitative material. Simply Wall St has no position in any stocks mentioned.
About NSEI:KSCL
Kaveri Seed
Researches, develops, produces, processes, and markets hybrid seeds and vegetable crop seeds in India.
Flawless balance sheet average dividend payer.
Similar Companies
Market Insights

Advertisement
Community Narratives
Enterprise, AI & Cloud Growth Ahead, Waiting For the Right Price 💸
Fair Value US$204.74|9.5% overvalued
FR
Community Contributor
Good foundation, but now it's all about the next steps
Fair Value US$147.87|27.6% undervalued
TO
Community Contributor
XTB's Path to 100–120 PLN by 2028 Amid Market Volatility
Fair Value zł100.96|36.6% undervalued
DZ
Community Contributor