

Some say volatility, rather than debt, is the best way to think about risk as an investor, but Warren Buffett famously said that 'Volatility is far from synonymous with risk.' So it might be obvious that you need to consider debt, when you think about how risky any given stock is, because too much debt can sink a company. Importantly, ITC Limited (NSE:ITC) does carry debt. But is this debt a concern to shareholders?
When Is Debt Dangerous?
Generally speaking, debt only becomes a real problem when a company can't easily pay it off, either by raising capital or with its own cash flow. In the worst case scenario, a company can go bankrupt if it cannot pay its creditors. However, a more frequent (but still costly) occurrence is where a company must issue shares at bargain-basement prices, permanently diluting shareholders, just to shore up its balance sheet. Of course, the upside of debt is that it often represents cheap capital, especially when it replaces dilution in a company with the ability to reinvest at high rates of return. When we think about a company's use of debt, we first look at cash and debt together.
View our latest analysis for ITC
What Is ITC's Debt?
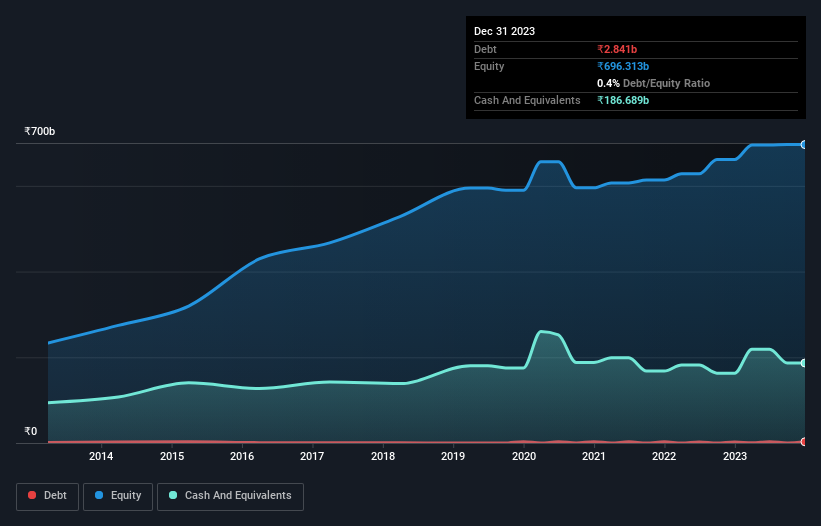
As you can see below, at the end of September 2023, ITC had ₹2.84b of debt, up from ₹2.53b a year ago. Click the image for more detail. But it also has ₹186.7b in cash to offset that, meaning it has ₹183.8b net cash.
A Look At ITC's Liabilities
According to the last reported balance sheet, ITC had liabilities of ₹148.0b due within 12 months, and liabilities of ₹27.0b due beyond 12 months. On the other hand, it had cash of ₹186.7b and ₹41.7b worth of receivables due within a year. So it actually has ₹53.4b more liquid assets than total liabilities.
This state of affairs indicates that ITC's balance sheet looks quite solid, as its total liabilities are just about equal to its liquid assets. So it's very unlikely that the ₹5.10t company is short on cash, but still worth keeping an eye on the balance sheet. Simply put, the fact that ITC has more cash than debt is arguably a good indication that it can manage its debt safely.
Fortunately, ITC grew its EBIT by 7.3% in the last year, making that debt load look even more manageable. When analysing debt levels, the balance sheet is the obvious place to start. But it is future earnings, more than anything, that will determine ITC's ability to maintain a healthy balance sheet going forward. So if you're focused on the future you can check out this free report showing analyst profit forecasts.
Finally, a company can only pay off debt with cold hard cash, not accounting profits. While ITC has net cash on its balance sheet, it's still worth taking a look at its ability to convert earnings before interest and tax (EBIT) to free cash flow, to help us understand how quickly it is building (or eroding) that cash balance. Over the most recent three years, ITC recorded free cash flow worth 67% of its EBIT, which is around normal, given free cash flow excludes interest and tax. This cold hard cash means it can reduce its debt when it wants to.
Summing Up
While it is always sensible to investigate a company's debt, in this case ITC has ₹183.8b in net cash and a decent-looking balance sheet. The cherry on top was that in converted 67% of that EBIT to free cash flow, bringing in ₹157b. So is ITC's debt a risk? It doesn't seem so to us. The balance sheet is clearly the area to focus on when you are analysing debt. However, not all investment risk resides within the balance sheet - far from it. For example - ITC has 1 warning sign we think you should be aware of.
Of course, if you're the type of investor who prefers buying stocks without the burden of debt, then don't hesitate to discover our exclusive list of net cash growth stocks, today.
New: AI Stock Screener & Alerts
Our new AI Stock Screener scans the market every day to uncover opportunities.
• Dividend Powerhouses (3%+ Yield)
• Undervalued Small Caps with Insider Buying
• High growth Tech and AI Companies
Or build your own from over 50 metrics.
Have feedback on this article? Concerned about the content? Get in touch with us directly. Alternatively, email editorial-team (at) simplywallst.com.
This article by Simply Wall St is general in nature. We provide commentary based on historical data and analyst forecasts only using an unbiased methodology and our articles are not intended to be financial advice. It does not constitute a recommendation to buy or sell any stock, and does not take account of your objectives, or your financial situation. We aim to bring you long-term focused analysis driven by fundamental data. Note that our analysis may not factor in the latest price-sensitive company announcements or qualitative material. Simply Wall St has no position in any stocks mentioned.
About NSEI:ITC
ITC
Engages in the fast-moving consumer goods, hotels, paperboards and paper and packaging, agri, and information technology businesses in India and internationally.
Flawless balance sheet established dividend payer.
Similar Companies
Market Insights

Community Narratives

