
Advertisement
Returns At DCM Shriram Industries (NSE:DCMSRIND) Appear To Be Weighed Down
What trends should we look for it we want to identify stocks that can multiply in value over the long term? One common approach is to try and find a company with returns on capital employed (ROCE) that are increasing, in conjunction with a growing amount of capital employed. Basically this means that a company has profitable initiatives that it can continue to reinvest in, which is a trait of a compounding machine. So, when we ran our eye over DCM Shriram Industries' (NSE:DCMSRIND) trend of ROCE, we liked what we saw.
Return On Capital Employed (ROCE): What Is It?
If you haven't worked with ROCE before, it measures the 'return' (pre-tax profit) a company generates from capital employed in its business. Analysts use this formula to calculate it for DCM Shriram Industries:
Return on Capital Employed = Earnings Before Interest and Tax (EBIT) ÷ (Total Assets - Current Liabilities)
0.19 = ₹1.8b ÷ (₹18b - ₹7.9b) (Based on the trailing twelve months to December 2023).
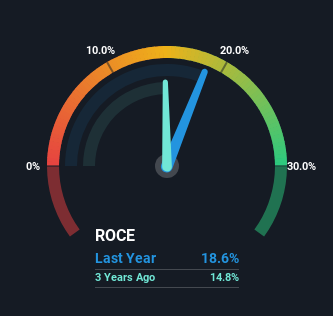
Thus, DCM Shriram Industries has an ROCE of 19%. In absolute terms, that's a satisfactory return, but compared to the Food industry average of 15% it's much better.
View our latest analysis for DCM Shriram Industries
While the past is not representative of the future, it can be helpful to know how a company has performed historically, which is why we have this chart above. If you want to delve into the historical earnings , check out these free graphs detailing revenue and cash flow performance of DCM Shriram Industries.
The Trend Of ROCE
While the current returns on capital are decent, they haven't changed much. The company has employed 70% more capital in the last five years, and the returns on that capital have remained stable at 19%. 19% is a pretty standard return, and it provides some comfort knowing that DCM Shriram Industries has consistently earned this amount. Over long periods of time, returns like these might not be too exciting, but with consistency they can pay off in terms of share price returns.
On a side note, DCM Shriram Industries' current liabilities are still rather high at 45% of total assets. This can bring about some risks because the company is basically operating with a rather large reliance on its suppliers or other sorts of short-term creditors. While it's not necessarily a bad thing, it can be beneficial if this ratio is lower.
The Bottom Line
To sum it up, DCM Shriram Industries has simply been reinvesting capital steadily, at those decent rates of return. And long term investors would be thrilled with the 206% return they've received over the last year. So while the positive underlying trends may be accounted for by investors, we still think this stock is worth looking into further.
One more thing to note, we've identified 1 warning sign with DCM Shriram Industries and understanding this should be part of your investment process.
While DCM Shriram Industries isn't earning the highest return, check out this free list of companies that are earning high returns on equity with solid balance sheets.
New: Manage All Your Stock Portfolios in One Place
We've created the ultimate portfolio companion for stock investors, and it's free.
• Connect an unlimited number of Portfolios and see your total in one currency
• Be alerted to new Warning Signs or Risks via email or mobile
• Track the Fair Value of your stocks
Have feedback on this article? Concerned about the content? Get in touch with us directly. Alternatively, email editorial-team (at) simplywallst.com.
This article by Simply Wall St is general in nature. We provide commentary based on historical data and analyst forecasts only using an unbiased methodology and our articles are not intended to be financial advice. It does not constitute a recommendation to buy or sell any stock, and does not take account of your objectives, or your financial situation. We aim to bring you long-term focused analysis driven by fundamental data. Note that our analysis may not factor in the latest price-sensitive company announcements or qualitative material. Simply Wall St has no position in any stocks mentioned.
About NSEI:DCMSRIND
DCM Shriram Industries
Engages in the production and sale of sugar, alcohol, power, chemicals, industrial fibers, and defence-related products in India, Europe, China, Mexico, and internationally.
Excellent balance sheet, good value and pays a dividend.
Market Insights

Advertisement
Community Narratives
A formidable player in AI and enterprise computing.
Fair Value US$210.00|3.1% overvalued
CO
Community Contributor
IREN's Bold Moves in Sustainable Bitcoin Mining & AI Data Centers
Fair Value US$72.52|11.6% undervalued
BL
Community Contributor
Cooling the Champions: The Aussie Tech Behind F1's Victories
Fair Value AU$12.40|39.4% undervalued
TR
Community Contributor