
Advertisement

Warren Buffett famously said, 'Volatility is far from synonymous with risk.' So it seems the smart money knows that debt - which is usually involved in bankruptcies - is a very important factor, when you assess how risky a company is. As with many other companies Oil India Limited (NSE:OIL) makes use of debt. But is this debt a concern to shareholders?
Why Does Debt Bring Risk?
Generally speaking, debt only becomes a real problem when a company can't easily pay it off, either by raising capital or with its own cash flow. In the worst case scenario, a company can go bankrupt if it cannot pay its creditors. However, a more usual (but still expensive) situation is where a company must dilute shareholders at a cheap share price simply to get debt under control. Of course, plenty of companies use debt to fund growth, without any negative consequences. The first step when considering a company's debt levels is to consider its cash and debt together.
See our latest analysis for Oil India
What Is Oil India's Debt?
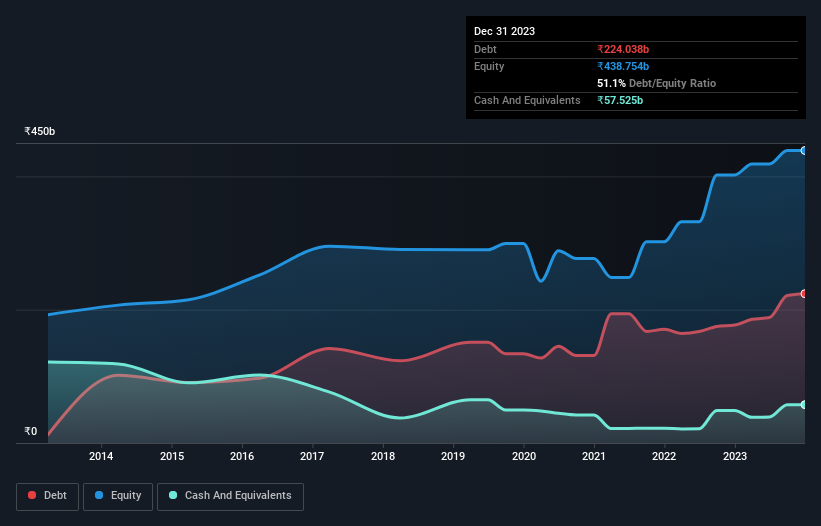
You can click the graphic below for the historical numbers, but it shows that as of September 2023 Oil India had ₹224.0b of debt, an increase on ₹176.9b, over one year. On the flip side, it has ₹57.5b in cash leading to net debt of about ₹166.5b.
How Healthy Is Oil India's Balance Sheet?
Zooming in on the latest balance sheet data, we can see that Oil India had liabilities of ₹147.7b due within 12 months and liabilities of ₹218.7b due beyond that. On the other hand, it had cash of ₹57.5b and ₹31.4b worth of receivables due within a year. So its liabilities total ₹277.5b more than the combination of its cash and short-term receivables.
Oil India has a market capitalization of ₹630.9b, so it could very likely raise cash to ameliorate its balance sheet, if the need arose. However, it is still worthwhile taking a close look at its ability to pay off debt.
We use two main ratios to inform us about debt levels relative to earnings. The first is net debt divided by earnings before interest, tax, depreciation, and amortization (EBITDA), while the second is how many times its earnings before interest and tax (EBIT) covers its interest expense (or its interest cover, for short). Thus we consider debt relative to earnings both with and without depreciation and amortization expenses.
Oil India has net debt of just 1.2 times EBITDA, suggesting it could ramp leverage without breaking a sweat. And remarkably, despite having net debt, it actually received more in interest over the last twelve months than it had to pay. So there's no doubt this company can take on debt while staying cool as a cucumber. On the other hand, Oil India's EBIT dived 16%, over the last year. We think hat kind of performance, if repeated frequently, could well lead to difficulties for the stock. There's no doubt that we learn most about debt from the balance sheet. But ultimately the future profitability of the business will decide if Oil India can strengthen its balance sheet over time. So if you want to see what the professionals think, you might find this free report on analyst profit forecasts to be interesting.
Finally, a business needs free cash flow to pay off debt; accounting profits just don't cut it. So we clearly need to look at whether that EBIT is leading to corresponding free cash flow. In the last three years, Oil India's free cash flow amounted to 21% of its EBIT, less than we'd expect. That weak cash conversion makes it more difficult to handle indebtedness.
Our View
Oil India's EBIT growth rate and conversion of EBIT to free cash flow definitely weigh on it, in our esteem. But the good news is it seems to be able to cover its interest expense with its EBIT with ease. When we consider all the factors discussed, it seems to us that Oil India is taking some risks with its use of debt. While that debt can boost returns, we think the company has enough leverage now. The balance sheet is clearly the area to focus on when you are analysing debt. However, not all investment risk resides within the balance sheet - far from it. For instance, we've identified 2 warning signs for Oil India that you should be aware of.
Of course, if you're the type of investor who prefers buying stocks without the burden of debt, then don't hesitate to discover our exclusive list of net cash growth stocks, today.
New: AI Stock Screener & Alerts
Our new AI Stock Screener scans the market every day to uncover opportunities.
• Dividend Powerhouses (3%+ Yield)
• Undervalued Small Caps with Insider Buying
• High growth Tech and AI Companies
Or build your own from over 50 metrics.
Have feedback on this article? Concerned about the content? Get in touch with us directly. Alternatively, email editorial-team (at) simplywallst.com.
This article by Simply Wall St is general in nature. We provide commentary based on historical data and analyst forecasts only using an unbiased methodology and our articles are not intended to be financial advice. It does not constitute a recommendation to buy or sell any stock, and does not take account of your objectives, or your financial situation. We aim to bring you long-term focused analysis driven by fundamental data. Note that our analysis may not factor in the latest price-sensitive company announcements or qualitative material. Simply Wall St has no position in any stocks mentioned.
About NSEI:OIL
Oil India
Engages in the exploration, development, and production of crude oil and natural gas in India.
Solid track record with adequate balance sheet and pays a dividend.
Similar Companies
Market Insights


Advertisement
Community Narratives
Nike's Direct-to-Consumer Focus Will Drive Future Growth
Fair Value US$87.90|22.7% undervalued
UN
Community Contributor
Novo Nordisk will dominate GLP-1 market with Ozempic and Wegovy growth
Fair Value US$89.59|14.2% undervalued
BE
Community Contributor
Rheinmetall could get 20-25% of EU-NATO 3%-GDP defence spending
Fair Value €7.57k|82.8% undervalued
NO
Community Contributor