
Warren Buffett famously said, 'Volatility is far from synonymous with risk.' So it seems the smart money knows that debt - which is usually involved in bankruptcies - is a very important factor, when you assess how risky a company is. Importantly, Indian Oil Corporation Limited (NSE:IOC) does carry debt. But the real question is whether this debt is making the company risky.
What Risk Does Debt Bring?
Debt and other liabilities become risky for a business when it cannot easily fulfill those obligations, either with free cash flow or by raising capital at an attractive price. In the worst case scenario, a company can go bankrupt if it cannot pay its creditors. While that is not too common, we often do see indebted companies permanently diluting shareholders because lenders force them to raise capital at a distressed price. Of course, the upside of debt is that it often represents cheap capital, especially when it replaces dilution in a company with the ability to reinvest at high rates of return. The first step when considering a company's debt levels is to consider its cash and debt together.
View our latest analysis for Indian Oil
What Is Indian Oil's Net Debt?
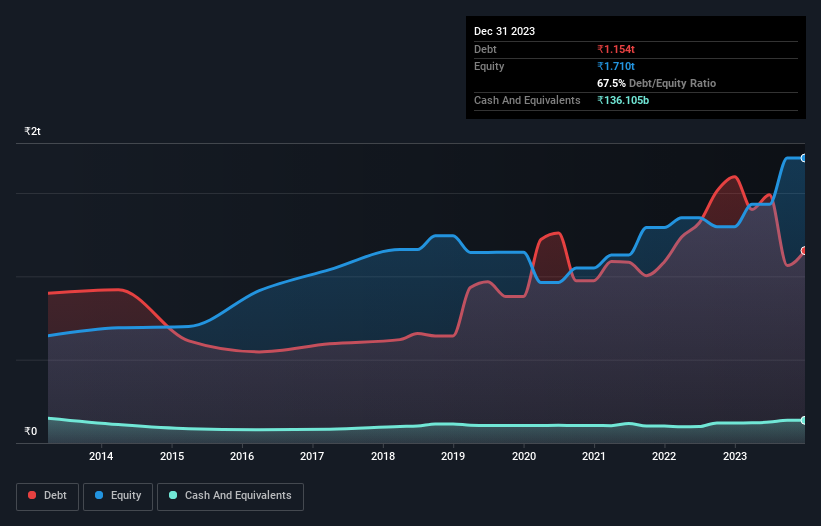
As you can see below, Indian Oil had ₹1.15t of debt at September 2023, down from ₹1.60t a year prior. However, it does have ₹136.1b in cash offsetting this, leading to net debt of about ₹1.02t.
How Strong Is Indian Oil's Balance Sheet?
We can see from the most recent balance sheet that Indian Oil had liabilities of ₹2.03t falling due within a year, and liabilities of ₹835.2b due beyond that. Offsetting this, it had ₹136.1b in cash and ₹131.7b in receivables that were due within 12 months. So it has liabilities totalling ₹2.60t more than its cash and near-term receivables, combined.
When you consider that this deficiency exceeds the company's huge ₹2.58t market capitalization, you might well be inclined to review the balance sheet intently. In the scenario where the company had to clean up its balance sheet quickly, it seems likely shareholders would suffer extensive dilution.
We use two main ratios to inform us about debt levels relative to earnings. The first is net debt divided by earnings before interest, tax, depreciation, and amortization (EBITDA), while the second is how many times its earnings before interest and tax (EBIT) covers its interest expense (or its interest cover, for short). This way, we consider both the absolute quantum of the debt, as well as the interest rates paid on it.
Indian Oil's net debt is only 1.2 times its EBITDA. And its EBIT covers its interest expense a whopping 27.0 times over. So you could argue it is no more threatened by its debt than an elephant is by a mouse. Even more impressive was the fact that Indian Oil grew its EBIT by 209% over twelve months. That boost will make it even easier to pay down debt going forward. The balance sheet is clearly the area to focus on when you are analysing debt. But it is future earnings, more than anything, that will determine Indian Oil's ability to maintain a healthy balance sheet going forward. So if you're focused on the future you can check out this free report showing analyst profit forecasts.
Finally, while the tax-man may adore accounting profits, lenders only accept cold hard cash. So the logical step is to look at the proportion of that EBIT that is matched by actual free cash flow. Looking at the most recent three years, Indian Oil recorded free cash flow of 36% of its EBIT, which is weaker than we'd expect. That's not great, when it comes to paying down debt.
Our View
Indian Oil's interest cover was a real positive on this analysis, as was its EBIT growth rate. Having said that, its level of total liabilities somewhat sensitizes us to potential future risks to the balance sheet. Looking at all this data makes us feel a little cautious about Indian Oil's debt levels. While we appreciate debt can enhance returns on equity, we'd suggest that shareholders keep close watch on its debt levels, lest they increase. The balance sheet is clearly the area to focus on when you are analysing debt. However, not all investment risk resides within the balance sheet - far from it. For instance, we've identified 3 warning signs for Indian Oil (1 doesn't sit too well with us) you should be aware of.
If, after all that, you're more interested in a fast growing company with a rock-solid balance sheet, then check out our list of net cash growth stocks without delay.
New: AI Stock Screener & Alerts
Our new AI Stock Screener scans the market every day to uncover opportunities.
• Dividend Powerhouses (3%+ Yield)
• Undervalued Small Caps with Insider Buying
• High growth Tech and AI Companies
Or build your own from over 50 metrics.
Have feedback on this article? Concerned about the content? Get in touch with us directly. Alternatively, email editorial-team (at) simplywallst.com.
This article by Simply Wall St is general in nature. We provide commentary based on historical data and analyst forecasts only using an unbiased methodology and our articles are not intended to be financial advice. It does not constitute a recommendation to buy or sell any stock, and does not take account of your objectives, or your financial situation. We aim to bring you long-term focused analysis driven by fundamental data. Note that our analysis may not factor in the latest price-sensitive company announcements or qualitative material. Simply Wall St has no position in any stocks mentioned.
About NSEI:IOC
Indian Oil
Indian Oil Corporation Limited, together with its subsidiaries, refines, pipeline transports, and markets petroleum products in India and internationally.
Fair value with moderate growth potential.
Similar Companies
Market Insights

Community Narratives
