
Advertisement
- India
- /
- Oil and Gas
- /
- NSEI:IOC
Indian Oil Corporation Limited (NSE:IOC) Held Back By Insufficient Growth Even After Shares Climb 29%
Despite an already strong run, Indian Oil Corporation Limited (NSE:IOC) shares have been powering on, with a gain of 29% in the last thirty days. The annual gain comes to 133% following the latest surge, making investors sit up and take notice.
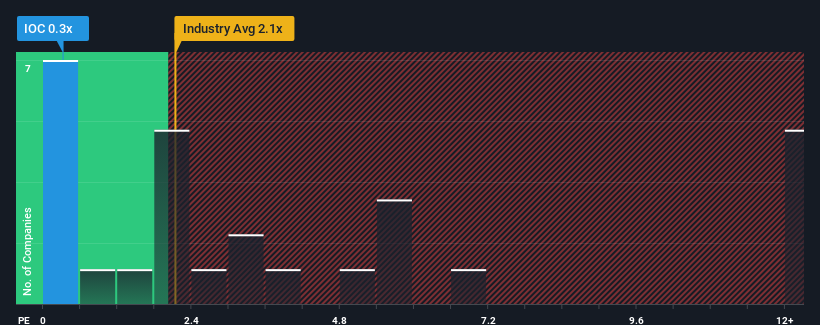
Although its price has surged higher, Indian Oil may still be sending buy signals at present with its price-to-sales (or "P/S") ratio of 0.3x, considering almost half of all companies in the Oil and Gas industry in India have P/S ratios greater than 2.1x and even P/S higher than 6x aren't out of the ordinary. Although, it's not wise to just take the P/S at face value as there may be an explanation why it's limited.
See our latest analysis for Indian Oil
What Does Indian Oil's P/S Mean For Shareholders?
Indian Oil has been struggling lately as its revenue has declined faster than most other companies. The P/S ratio is probably low because investors think this poor revenue performance isn't going to improve at all. So while you could say the stock is cheap, investors will be looking for improvement before they see it as good value. If not, then existing shareholders will probably struggle to get excited about the future direction of the share price.
Keen to find out how analysts think Indian Oil's future stacks up against the industry? In that case, our free report is a great place to start.Do Revenue Forecasts Match The Low P/S Ratio?
Indian Oil's P/S ratio would be typical for a company that's only expected to deliver limited growth, and importantly, perform worse than the industry.
Taking a look back first, the company's revenue growth last year wasn't something to get excited about as it posted a disappointing decline of 3.9%. Still, the latest three year period has seen an excellent 114% overall rise in revenue, in spite of its unsatisfying short-term performance. Although it's been a bumpy ride, it's still fair to say the revenue growth recently has been more than adequate for the company.
Looking ahead now, revenue is anticipated to slump, contracting by 0.4% during the coming year according to the analysts following the company. Meanwhile, the broader industry is forecast to expand by 8.3%, which paints a poor picture.
With this information, we are not surprised that Indian Oil is trading at a P/S lower than the industry. However, shrinking revenues are unlikely to lead to a stable P/S over the longer term. There's potential for the P/S to fall to even lower levels if the company doesn't improve its top-line growth.
The Key Takeaway
Indian Oil's stock price has surged recently, but its but its P/S still remains modest. It's argued the price-to-sales ratio is an inferior measure of value within certain industries, but it can be a powerful business sentiment indicator.
With revenue forecasts that are inferior to the rest of the industry, it's no surprise that Indian Oil's P/S is on the lower end of the spectrum. As other companies in the industry are forecasting revenue growth, Indian Oil's poor outlook justifies its low P/S ratio. Unless these conditions improve, they will continue to form a barrier for the share price around these levels.
It is also worth noting that we have found 3 warning signs for Indian Oil (1 doesn't sit too well with us!) that you need to take into consideration.
Of course, profitable companies with a history of great earnings growth are generally safer bets. So you may wish to see this free collection of other companies that have reasonable P/E ratios and have grown earnings strongly.
New: AI Stock Screener & Alerts
Our new AI Stock Screener scans the market every day to uncover opportunities.
• Dividend Powerhouses (3%+ Yield)
• Undervalued Small Caps with Insider Buying
• High growth Tech and AI Companies
Or build your own from over 50 metrics.
Have feedback on this article? Concerned about the content? Get in touch with us directly. Alternatively, email editorial-team (at) simplywallst.com.
This article by Simply Wall St is general in nature. We provide commentary based on historical data and analyst forecasts only using an unbiased methodology and our articles are not intended to be financial advice. It does not constitute a recommendation to buy or sell any stock, and does not take account of your objectives, or your financial situation. We aim to bring you long-term focused analysis driven by fundamental data. Note that our analysis may not factor in the latest price-sensitive company announcements or qualitative material. Simply Wall St has no position in any stocks mentioned.
About NSEI:IOC
Indian Oil
Indian Oil Corporation Limited, together with its subsidiaries, refines, pipeline transports, and markets petroleum products in India and internationally.
Fair value with moderate growth potential.
Similar Companies
Market Insights

Advertisement
Community Narratives
The Most Undervalued of the Magnificent 7
Fair Value US$237.43|36.3% undervalued
IN
Community Contributor
PVA TePla's New Strategy Aims for 22% Revenue Growth in Semiconductor Recovery
Fair Value €19.19|20.8% undervalued
MI
Community Contributor