
Advertisement
- India
- /
- Oil and Gas
- /
- NSEI:COALINDIA
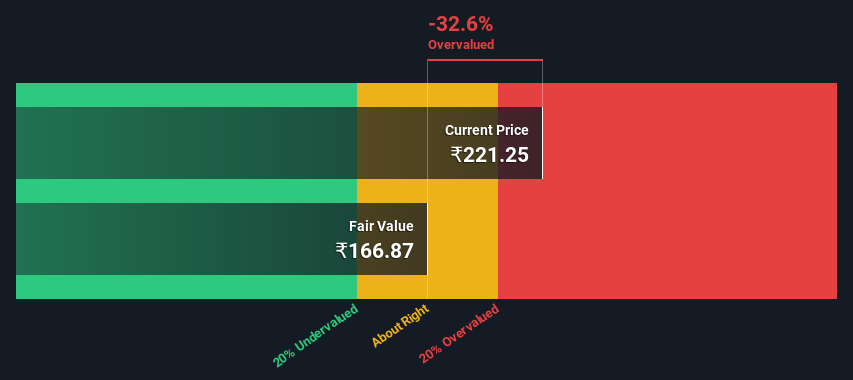
Coal India Limited (NSE:COALINDIA) Shares Could Be 33% Above Their Intrinsic Value Estimate

Does the December share price for Coal India Limited (NSE:COALINDIA) reflect what it's really worth? Today, we will estimate the stock's intrinsic value by taking the forecast future cash flows of the company and discounting them back to today's value. Our analysis will employ the Discounted Cash Flow (DCF) model. Don't get put off by the jargon, the math behind it is actually quite straightforward.
We would caution that there are many ways of valuing a company and, like the DCF, each technique has advantages and disadvantages in certain scenarios. Anyone interested in learning a bit more about intrinsic value should have a read of the Simply Wall St analysis model.
Check out our latest analysis for Coal India
Is Coal India Fairly Valued?
We use what is known as a 2-stage model, which simply means we have two different periods of growth rates for the company's cash flows. Generally the first stage is higher growth, and the second stage is a lower growth phase. In the first stage we need to estimate the cash flows to the business over the next ten years. Where possible we use analyst estimates, but when these aren't available we extrapolate the previous free cash flow (FCF) from the last estimate or reported value. We assume companies with shrinking free cash flow will slow their rate of shrinkage, and that companies with growing free cash flow will see their growth rate slow, over this period. We do this to reflect that growth tends to slow more in the early years than it does in later years.
Generally we assume that a dollar today is more valuable than a dollar in the future, so we need to discount the sum of these future cash flows to arrive at a present value estimate:
10-year free cash flow (FCF) estimate
| 2023 | 2024 | 2025 | 2026 | 2027 | 2028 | 2029 | 2030 | 2031 | 2032 | |
| Levered FCF (₹, Millions) | ₹274.6b | ₹127.8b | ₹165.0b | ₹138.3b | ₹125.5b | ₹119.9b | ₹118.6b | ₹120.1b | ₹123.6b | ₹128.6b |
| Growth Rate Estimate Source | Analyst x6 | Analyst x9 | Analyst x8 | Est @ -16.18% | Est @ -9.29% | Est @ -4.47% | Est @ -1.09% | Est @ 1.27% | Est @ 2.93% | Est @ 4.09% |
| Present Value (₹, Millions) Discounted @ 17% | ₹234.9k | ₹93.6k | ₹103.3k | ₹74.1k | ₹57.5k | ₹47.0k | ₹39.8k | ₹34.5k | ₹30.4k | ₹27.0k |
("Est" = FCF growth rate estimated by Simply Wall St)
Present Value of 10-year Cash Flow (PVCF) = ₹742b
The second stage is also known as Terminal Value, this is the business's cash flow after the first stage. The Gordon Growth formula is used to calculate Terminal Value at a future annual growth rate equal to the 5-year average of the 10-year government bond yield of 6.8%. We discount the terminal cash flows to today's value at a cost of equity of 17%.
Terminal Value (TV)= FCF2032 × (1 + g) ÷ (r – g) = ₹129b× (1 + 6.8%) ÷ (17%– 6.8%) = ₹1.4t
Present Value of Terminal Value (PVTV)= TV / (1 + r)10= ₹1.4t÷ ( 1 + 17%)10= ₹286b
The total value, or equity value, is then the sum of the present value of the future cash flows, which in this case is ₹1.0t. To get the intrinsic value per share, we divide this by the total number of shares outstanding. Compared to the current share price of ₹221, the company appears potentially overvalued at the time of writing. The assumptions in any calculation have a big impact on the valuation, so it is better to view this as a rough estimate, not precise down to the last cent.
Important Assumptions
The calculation above is very dependent on two assumptions. The first is the discount rate and the other is the cash flows. Part of investing is coming up with your own evaluation of a company's future performance, so try the calculation yourself and check your own assumptions. The DCF also does not consider the possible cyclicality of an industry, or a company's future capital requirements, so it does not give a full picture of a company's potential performance. Given that we are looking at Coal India as potential shareholders, the cost of equity is used as the discount rate, rather than the cost of capital (or weighted average cost of capital, WACC) which accounts for debt. In this calculation we've used 17%, which is based on a levered beta of 1.198. Beta is a measure of a stock's volatility, compared to the market as a whole. We get our beta from the industry average beta of globally comparable companies, with an imposed limit between 0.8 and 2.0, which is a reasonable range for a stable business.
SWOT Analysis for Coal India
Strength
- Earnings growth over the past year exceeded the industry.
- Debt is not viewed as a risk.
- Dividends are covered by earnings and cash flows.
- Dividend is in the top 25% of dividend payers in the market.
Weakness
- No major weaknesses identified for COALINDIA.
Opportunity
- Good value based on P/E ratio compared to estimated Fair P/E ratio.
Threat
- Annual earnings are forecast to decline for the next 3 years.
Looking Ahead:
Whilst important, the DCF calculation ideally won't be the sole piece of analysis you scrutinize for a company. DCF models are not the be-all and end-all of investment valuation. Instead the best use for a DCF model is to test certain assumptions and theories to see if they would lead to the company being undervalued or overvalued. For example, changes in the company's cost of equity or the risk free rate can significantly impact the valuation. Can we work out why the company is trading at a premium to intrinsic value? For Coal India, there are three essential items you should look at:
- Risks: Be aware that Coal India is showing 2 warning signs in our investment analysis , and 1 of those can't be ignored...
- Future Earnings: How does COALINDIA's growth rate compare to its peers and the wider market? Dig deeper into the analyst consensus number for the upcoming years by interacting with our free analyst growth expectation chart.
- Other Solid Businesses: Low debt, high returns on equity and good past performance are fundamental to a strong business. Why not explore our interactive list of stocks with solid business fundamentals to see if there are other companies you may not have considered!
PS. The Simply Wall St app conducts a discounted cash flow valuation for every stock on the NSEI every day. If you want to find the calculation for other stocks just search here.
New: AI Stock Screener & Alerts
Our new AI Stock Screener scans the market every day to uncover opportunities.
• Dividend Powerhouses (3%+ Yield)
• Undervalued Small Caps with Insider Buying
• High growth Tech and AI Companies
Or build your own from over 50 metrics.
Have feedback on this article? Concerned about the content? Get in touch with us directly. Alternatively, email editorial-team (at) simplywallst.com.
This article by Simply Wall St is general in nature. We provide commentary based on historical data and analyst forecasts only using an unbiased methodology and our articles are not intended to be financial advice. It does not constitute a recommendation to buy or sell any stock, and does not take account of your objectives, or your financial situation. We aim to bring you long-term focused analysis driven by fundamental data. Note that our analysis may not factor in the latest price-sensitive company announcements or qualitative material. Simply Wall St has no position in any stocks mentioned.
About NSEI:COALINDIA
Coal India
Engages in the production and marketing of coal and coal products in India.
Solid track record with excellent balance sheet.
Market Insights


Advertisement
Community Narratives
Rocket Lab USA Will Ignite a 30% Revenue Growth Journey
Fair Value US$31.72|41.9% undervalued
KI
Community Contributor
EasyJet weirdly unloved by investors in spite of relatively attractive metrics
Fair Value UK£6.95|31.9% undervalued
PI
Community Contributor
HEXPOL AB: Sustained Long Term Growth, Stable Margins, and Strategic M&A
Fair Value SEK 122.27|24.9% undervalued
MA
Community Contributor