- India
- /
- Consumer Finance
- /
- NSEI:MASFIN
Does MAS Financial Services' (NSE:MASFIN) Share Price Gain of 72% Match Its Business Performance?


By buying an index fund, investors can approximate the average market return. But if you buy good businesses at attractive prices, your portfolio returns could exceed the average market return. For example, the MAS Financial Services Limited (NSE:MASFIN) share price is up 72% in the last three years, clearly besting the market decline of around 0.6% (not including dividends). On the other hand, the returns haven't been quite so good recently, with shareholders up just 50% , including dividends .
See our latest analysis for MAS Financial Services
While markets are a powerful pricing mechanism, share prices reflect investor sentiment, not just underlying business performance. One imperfect but simple way to consider how the market perception of a company has shifted is to compare the change in the earnings per share (EPS) with the share price movement.
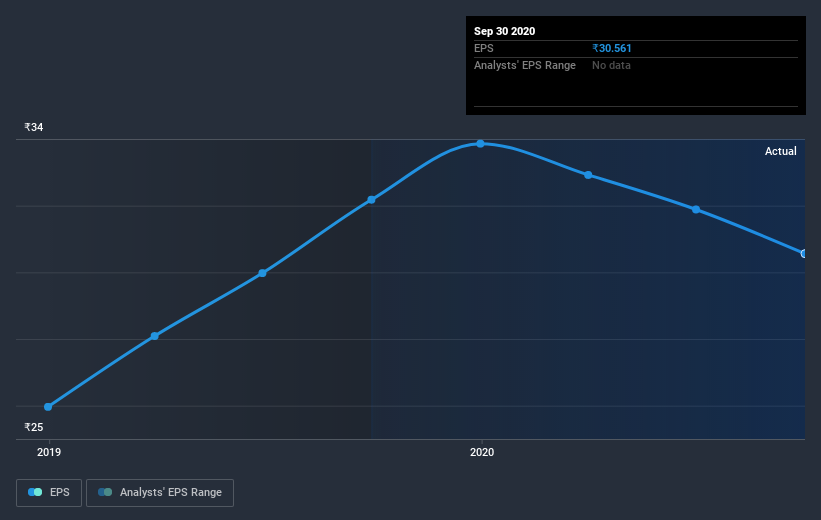
During three years of share price growth, MAS Financial Services achieved compound earnings per share growth of 19% per year. Notably, the 20% average annual share price gain matches up nicely with the EPS growth rate. This suggests that sentiment and expectations have not changed drastically. Rather, the share price has approximately tracked EPS growth.
The image below shows how EPS has tracked over time (if you click on the image you can see greater detail).
We consider it positive that insiders have made significant purchases in the last year. Even so, future earnings will be far more important to whether current shareholders make money. This free interactive report on MAS Financial Services' earnings, revenue and cash flow is a great place to start, if you want to investigate the stock further.
What About Dividends?
When looking at investment returns, it is important to consider the difference between total shareholder return (TSR) and share price return. The TSR incorporates the value of any spin-offs or discounted capital raisings, along with any dividends, based on the assumption that the dividends are reinvested. So for companies that pay a generous dividend, the TSR is often a lot higher than the share price return. As it happens, MAS Financial Services' TSR for the last 3 years was 75%, which exceeds the share price return mentioned earlier. This is largely a result of its dividend payments!
A Different Perspective
We're pleased to report that MAS Financial Services rewarded shareholders with a total shareholder return of 50% over the last year. And yes, that does include the dividend. That's better than the annualized TSR of 21% over the last three years. Given the track record of solid returns over varying time frames, it might be worth putting MAS Financial Services on your watchlist. While it is well worth considering the different impacts that market conditions can have on the share price, there are other factors that are even more important. To that end, you should be aware of the 3 warning signs we've spotted with MAS Financial Services .
MAS Financial Services is not the only stock that insiders are buying. For those who like to find winning investments this free list of growing companies with recent insider purchasing, could be just the ticket.
Please note, the market returns quoted in this article reflect the market weighted average returns of stocks that currently trade on IN exchanges.
If you decide to trade MAS Financial Services, use the lowest-cost* platform that is rated #1 Overall by Barron’s, Interactive Brokers. Trade stocks, options, futures, forex, bonds and funds on 135 markets, all from a single integrated account. Promoted
New: Manage All Your Stock Portfolios in One Place
We've created the ultimate portfolio companion for stock investors, and it's free.
• Connect an unlimited number of Portfolios and see your total in one currency
• Be alerted to new Warning Signs or Risks via email or mobile
• Track the Fair Value of your stocks
This article by Simply Wall St is general in nature. It does not constitute a recommendation to buy or sell any stock, and does not take account of your objectives, or your financial situation. We aim to bring you long-term focused analysis driven by fundamental data. Note that our analysis may not factor in the latest price-sensitive company announcements or qualitative material. Simply Wall St has no position in any stocks mentioned.
*Interactive Brokers Rated Lowest Cost Broker by StockBrokers.com Annual Online Review 2020
Have feedback on this article? Concerned about the content? Get in touch with us directly. Alternatively, email editorial-team@simplywallst.com.
About NSEI:MASFIN
MAS Financial Services
A non-banking finance company, provides retail financing services in India.
Proven track record and slightly overvalued.
Market Insights

Community Narratives

