- India
- /
- Hospitality
- /
- NSEI:RBA
Restaurant Brands Asia Limited (NSE:RBA) Stock Rockets 29% As Investors Are Less Pessimistic Than Expected


The Restaurant Brands Asia Limited (NSE:RBA) share price has done very well over the last month, posting an excellent gain of 29%. The last 30 days bring the annual gain to a very sharp 31%.
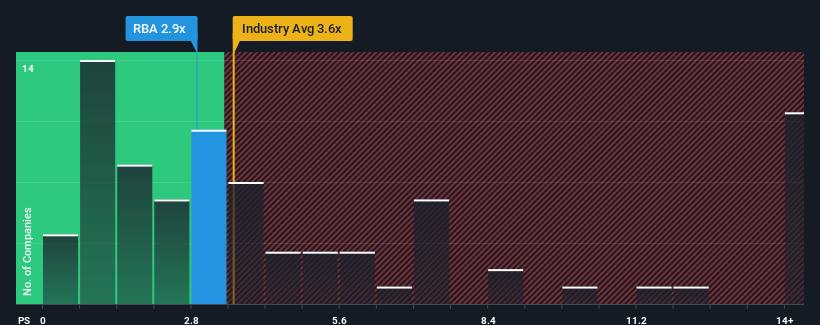
In spite of the firm bounce in price, it's still not a stretch to say that Restaurant Brands Asia's price-to-sales (or "P/S") ratio of 2.9x right now seems quite "middle-of-the-road" compared to the Hospitality industry in India, where the median P/S ratio is around 3.6x. While this might not raise any eyebrows, if the P/S ratio is not justified investors could be missing out on a potential opportunity or ignoring looming disappointment.
View our latest analysis for Restaurant Brands Asia
What Does Restaurant Brands Asia's P/S Mean For Shareholders?
Restaurant Brands Asia could be doing better as it's been growing revenue less than most other companies lately. One possibility is that the P/S ratio is moderate because investors think this lacklustre revenue performance will turn around. However, if this isn't the case, investors might get caught out paying too much for the stock.
If you'd like to see what analysts are forecasting going forward, you should check out our free report on Restaurant Brands Asia.Is There Some Revenue Growth Forecasted For Restaurant Brands Asia?
The only time you'd be comfortable seeing a P/S like Restaurant Brands Asia's is when the company's growth is tracking the industry closely.
Retrospectively, the last year delivered an exceptional 40% gain to the company's top line. Pleasingly, revenue has also lifted 148% in aggregate from three years ago, thanks to the last 12 months of growth. So we can start by confirming that the company has done a great job of growing revenue over that time.
Shifting to the future, estimates from the nine analysts covering the company suggest revenue should grow by 4.0% each year over the next three years. Meanwhile, the rest of the industry is forecast to expand by 21% per year, which is noticeably more attractive.
With this information, we find it interesting that Restaurant Brands Asia is trading at a fairly similar P/S compared to the industry. It seems most investors are ignoring the fairly limited growth expectations and are willing to pay up for exposure to the stock. Maintaining these prices will be difficult to achieve as this level of revenue growth is likely to weigh down the shares eventually.
What Does Restaurant Brands Asia's P/S Mean For Investors?
Restaurant Brands Asia appears to be back in favour with a solid price jump bringing its P/S back in line with other companies in the industry We'd say the price-to-sales ratio's power isn't primarily as a valuation instrument but rather to gauge current investor sentiment and future expectations.
Given that Restaurant Brands Asia's revenue growth projections are relatively subdued in comparison to the wider industry, it comes as a surprise to see it trading at its current P/S ratio. When we see companies with a relatively weaker revenue outlook compared to the industry, we suspect the share price is at risk of declining, sending the moderate P/S lower. A positive change is needed in order to justify the current price-to-sales ratio.
A lot of potential risks can sit within a company's balance sheet. You can assess many of the main risks through our free balance sheet analysis for Restaurant Brands Asia with six simple checks.
If these risks are making you reconsider your opinion on Restaurant Brands Asia, explore our interactive list of high quality stocks to get an idea of what else is out there.
New: AI Stock Screener & Alerts
Our new AI Stock Screener scans the market every day to uncover opportunities.
• Dividend Powerhouses (3%+ Yield)
• Undervalued Small Caps with Insider Buying
• High growth Tech and AI Companies
Or build your own from over 50 metrics.
Have feedback on this article? Concerned about the content? Get in touch with us directly. Alternatively, email editorial-team (at) simplywallst.com.
This article by Simply Wall St is general in nature. We provide commentary based on historical data and analyst forecasts only using an unbiased methodology and our articles are not intended to be financial advice. It does not constitute a recommendation to buy or sell any stock, and does not take account of your objectives, or your financial situation. We aim to bring you long-term focused analysis driven by fundamental data. Note that our analysis may not factor in the latest price-sensitive company announcements or qualitative material. Simply Wall St has no position in any stocks mentioned.
About NSEI:RBA
Restaurant Brands Asia
Together with its subsidiaries operates quick service restaurant chains in India and Indonesia.
Fair value with imperfect balance sheet.
Market Insights

Community Narratives
