

Key Insights
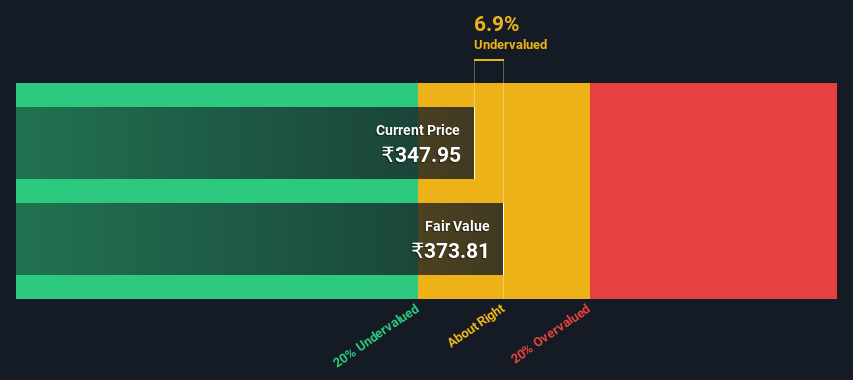
- Using the 2 Stage Free Cash Flow to Equity, Kaya fair value estimate is ₹374
- Kaya's ₹348 share price indicates it is trading at similar levels as its fair value estimate
- The average premium for Kaya's competitorsis currently 381%
How far off is Kaya Limited (NSE:KAYA) from its intrinsic value? Using the most recent financial data, we'll take a look at whether the stock is fairly priced by projecting its future cash flows and then discounting them to today's value. One way to achieve this is by employing the Discounted Cash Flow (DCF) model. There's really not all that much to it, even though it might appear quite complex.
Companies can be valued in a lot of ways, so we would point out that a DCF is not perfect for every situation. Anyone interested in learning a bit more about intrinsic value should have a read of the Simply Wall St analysis model.
See our latest analysis for Kaya
The Calculation
We're using the 2-stage growth model, which simply means we take in account two stages of company's growth. In the initial period the company may have a higher growth rate and the second stage is usually assumed to have a stable growth rate. To begin with, we have to get estimates of the next ten years of cash flows. Seeing as no analyst estimates of free cash flow are available to us, we have extrapolate the previous free cash flow (FCF) from the company's last reported value. We assume companies with shrinking free cash flow will slow their rate of shrinkage, and that companies with growing free cash flow will see their growth rate slow, over this period. We do this to reflect that growth tends to slow more in the early years than it does in later years.
A DCF is all about the idea that a dollar in the future is less valuable than a dollar today, and so the sum of these future cash flows is then discounted to today's value:
10-year free cash flow (FCF) forecast
| 2024 | 2025 | 2026 | 2027 | 2028 | 2029 | 2030 | 2031 | 2032 | 2033 | |
| Levered FCF (₹, Millions) | ₹413.9m | ₹462.6m | ₹510.0m | ₹556.9m | ₹604.0m | ₹652.0m | ₹701.4m | ₹752.7m | ₹806.5m | ₹863.1m |
| Growth Rate Estimate Source | Est @ 13.92% | Est @ 11.76% | Est @ 10.25% | Est @ 9.20% | Est @ 8.46% | Est @ 7.94% | Est @ 7.58% | Est @ 7.32% | Est @ 7.14% | Est @ 7.02% |
| Present Value (₹, Millions) Discounted @ 16% | ₹356 | ₹342 | ₹324 | ₹305 | ₹284 | ₹264 | ₹244 | ₹225 | ₹208 | ₹191 |
("Est" = FCF growth rate estimated by Simply Wall St)
Present Value of 10-year Cash Flow (PVCF) = ₹2.7b
We now need to calculate the Terminal Value, which accounts for all the future cash flows after this ten year period. For a number of reasons a very conservative growth rate is used that cannot exceed that of a country's GDP growth. In this case we have used the 5-year average of the 10-year government bond yield (6.7%) to estimate future growth. In the same way as with the 10-year 'growth' period, we discount future cash flows to today's value, using a cost of equity of 16%.
Terminal Value (TV)= FCF2033 × (1 + g) ÷ (r – g) = ₹863m× (1 + 6.7%) ÷ (16%– 6.7%) = ₹9.7b
Present Value of Terminal Value (PVTV)= TV / (1 + r)10= ₹9.7b÷ ( 1 + 16%)10= ₹2.1b
The total value, or equity value, is then the sum of the present value of the future cash flows, which in this case is ₹4.9b. In the final step we divide the equity value by the number of shares outstanding. Compared to the current share price of ₹348, the company appears about fair value at a 6.9% discount to where the stock price trades currently. Valuations are imprecise instruments though, rather like a telescope - move a few degrees and end up in a different galaxy. Do keep this in mind.
The Assumptions
We would point out that the most important inputs to a discounted cash flow are the discount rate and of course the actual cash flows. Part of investing is coming up with your own evaluation of a company's future performance, so try the calculation yourself and check your own assumptions. The DCF also does not consider the possible cyclicality of an industry, or a company's future capital requirements, so it does not give a full picture of a company's potential performance. Given that we are looking at Kaya as potential shareholders, the cost of equity is used as the discount rate, rather than the cost of capital (or weighted average cost of capital, WACC) which accounts for debt. In this calculation we've used 16%, which is based on a levered beta of 1.145. Beta is a measure of a stock's volatility, compared to the market as a whole. We get our beta from the industry average beta of globally comparable companies, with an imposed limit between 0.8 and 2.0, which is a reasonable range for a stable business.
SWOT Analysis for Kaya
- Debt is well covered by earnings and cashflows.
- No major weaknesses identified for KAYA.
- Has sufficient cash runway for more than 3 years based on current free cash flows.
- Current share price is below our estimate of fair value.
- Lack of analyst coverage makes it difficult to determine KAYA's earnings prospects.
- Total liabilities exceed total assets, which raises the risk of financial distress.
Looking Ahead:
Valuation is only one side of the coin in terms of building your investment thesis, and it is only one of many factors that you need to assess for a company. It's not possible to obtain a foolproof valuation with a DCF model. Preferably you'd apply different cases and assumptions and see how they would impact the company's valuation. For instance, if the terminal value growth rate is adjusted slightly, it can dramatically alter the overall result. For Kaya, we've put together three further aspects you should look at:
- Risks: Case in point, we've spotted 3 warning signs for Kaya you should be aware of, and 2 of them make us uncomfortable.
- Other High Quality Alternatives: Do you like a good all-rounder? Explore our interactive list of high quality stocks to get an idea of what else is out there you may be missing!
- Other Top Analyst Picks: Interested to see what the analysts are thinking? Take a look at our interactive list of analysts' top stock picks to find out what they feel might have an attractive future outlook!
PS. Simply Wall St updates its DCF calculation for every Indian stock every day, so if you want to find the intrinsic value of any other stock just search here.
If you're looking to trade Kaya, open an account with the lowest-cost platform trusted by professionals, Interactive Brokers.
With clients in over 200 countries and territories, and access to 160 markets, IBKR lets you trade stocks, options, futures, forex, bonds and funds from a single integrated account.
Enjoy no hidden fees, no account minimums, and FX conversion rates as low as 0.03%, far better than what most brokers offer.
Sponsored ContentValuation is complex, but we're here to simplify it.
Discover if Kaya might be undervalued or overvalued with our detailed analysis, featuring fair value estimates, potential risks, dividends, insider trades, and its financial condition.
Access Free AnalysisHave feedback on this article? Concerned about the content? Get in touch with us directly. Alternatively, email editorial-team (at) simplywallst.com.
This article by Simply Wall St is general in nature. We provide commentary based on historical data and analyst forecasts only using an unbiased methodology and our articles are not intended to be financial advice. It does not constitute a recommendation to buy or sell any stock, and does not take account of your objectives, or your financial situation. We aim to bring you long-term focused analysis driven by fundamental data. Note that our analysis may not factor in the latest price-sensitive company announcements or qualitative material. Simply Wall St has no position in any stocks mentioned.
About NSEI:KAYA
Kaya
Owns and operates skin and hair care clinics in India and the Middle East.
Low and slightly overvalued.
Market Insights

Community Narratives


