
Advertisement
- India
- /
- Food and Staples Retail
- /
- NSEI:OSIAHYPER
It's Down 26% But Osia Hyper Retail Limited (NSE:OSIAHYPER) Could Be Riskier Than It Looks
Osia Hyper Retail Limited (NSE:OSIAHYPER) shareholders that were waiting for something to happen have been dealt a blow with a 26% share price drop in the last month. The drop over the last 30 days has capped off a tough year for shareholders, with the share price down 30% in that time.
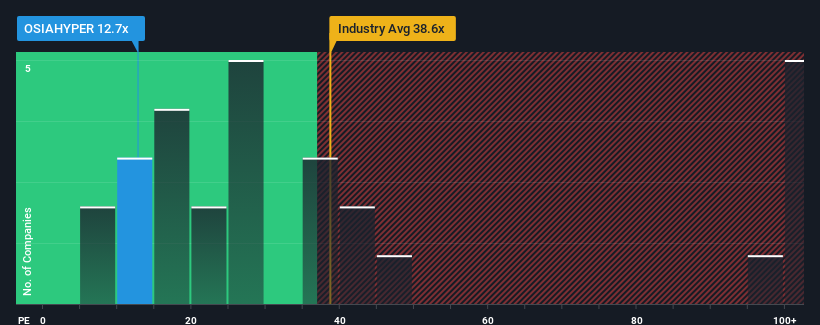
After such a large drop in price, Osia Hyper Retail may be sending very bullish signals at the moment with its price-to-earnings (or "P/E") ratio of 12.7x, since almost half of all companies in India have P/E ratios greater than 33x and even P/E's higher than 64x are not unusual. However, the P/E might be quite low for a reason and it requires further investigation to determine if it's justified.
Osia Hyper Retail certainly has been doing a great job lately as it's been growing earnings at a really rapid pace. It might be that many expect the strong earnings performance to degrade substantially, which has repressed the P/E. If that doesn't eventuate, then existing shareholders have reason to be quite optimistic about the future direction of the share price.
Check out our latest analysis for Osia Hyper Retail
How Is Osia Hyper Retail's Growth Trending?
In order to justify its P/E ratio, Osia Hyper Retail would need to produce anemic growth that's substantially trailing the market.
Taking a look back first, we see that the company grew earnings per share by an impressive 59% last year. The strong recent performance means it was also able to grow EPS by 212% in total over the last three years. So we can start by confirming that the company has done a great job of growing earnings over that time.
Weighing that recent medium-term earnings trajectory against the broader market's one-year forecast for expansion of 25% shows it's noticeably more attractive on an annualised basis.
With this information, we find it odd that Osia Hyper Retail is trading at a P/E lower than the market. It looks like most investors are not convinced the company can maintain its recent growth rates.
What We Can Learn From Osia Hyper Retail's P/E?
Shares in Osia Hyper Retail have plummeted and its P/E is now low enough to touch the ground. We'd say the price-to-earnings ratio's power isn't primarily as a valuation instrument but rather to gauge current investor sentiment and future expectations.
Our examination of Osia Hyper Retail revealed its three-year earnings trends aren't contributing to its P/E anywhere near as much as we would have predicted, given they look better than current market expectations. When we see strong earnings with faster-than-market growth, we assume potential risks are what might be placing significant pressure on the P/E ratio. It appears many are indeed anticipating earnings instability, because the persistence of these recent medium-term conditions would normally provide a boost to the share price.
You always need to take note of risks, for example - Osia Hyper Retail has 3 warning signs we think you should be aware of.
If these risks are making you reconsider your opinion on Osia Hyper Retail, explore our interactive list of high quality stocks to get an idea of what else is out there.
New: AI Stock Screener & Alerts
Our new AI Stock Screener scans the market every day to uncover opportunities.
• Dividend Powerhouses (3%+ Yield)
• Undervalued Small Caps with Insider Buying
• High growth Tech and AI Companies
Or build your own from over 50 metrics.
Have feedback on this article? Concerned about the content? Get in touch with us directly. Alternatively, email editorial-team (at) simplywallst.com.
This article by Simply Wall St is general in nature. We provide commentary based on historical data and analyst forecasts only using an unbiased methodology and our articles are not intended to be financial advice. It does not constitute a recommendation to buy or sell any stock, and does not take account of your objectives, or your financial situation. We aim to bring you long-term focused analysis driven by fundamental data. Note that our analysis may not factor in the latest price-sensitive company announcements or qualitative material. Simply Wall St has no position in any stocks mentioned.
Have feedback on this article? Concerned about the content? Get in touch with us directly. Alternatively, email editorial-team@simplywallst.com
About NSEI:OSIAHYPER
Osia Hyper Retail
Operates a supermarket chain under the Osia Hypermart name in India.
Adequate balance sheet with slight risk.
Similar Companies
Market Insights

Advertisement
Weekly Picks
RO


RockeTeller on Santacruz Silver Mining ·
Crazy Undervalued 42 Baggers Silver Play (Active & Running Mine)
Fair Value:CA$8696.7% undervalued
34 followersusers have followed this narrative
6 commentsusers have commented on this narrative
9 likesusers have liked this narrative
RO


Robbo on Fiducian Group ·
Fiducian: Compliance Clouds or Value Opportunity?
Fair Value:AU$126.1% undervalued
4 followersusers have followed this narrative
0 commentsusers have commented on this narrative
0 likesusers have liked this narrative
WO

woodworthfund on Willamette Valley Vineyards ·
Willamette Valley Vineyards (WVVI): Not-So-Great Value
Fair Value:US$242.5% overvalued
6 followersusers have followed this narrative
0 commentsusers have commented on this narrative
1 likeusers have liked this narrative
Recently Updated Narratives
FU

FundamentallySarcastic on Credit Corp Group ·
Moderation and Stabilisation: HOLD: Fair Price based on a 4-year Cycle is $12.08
Fair Value:AU$12.6411.4% overvalued
1 followerusers have followed this narrative
0 commentsusers have commented on this narrative
0 likesusers have liked this narrative
MA


MarkoVT on Alphabet ·
Positioned globally, partnered locally
Fair Value:US$390.1919.1% undervalued
1 followerusers have followed this narrative
0 commentsusers have commented on this narrative
0 likesusers have liked this narrative
JO


JohnJ on Worldline ·
When will fraudsters be investigated in depth. Fraud was ongoing in France too.
Fair Value:€0.5190.0% overvalued
1 followerusers have followed this narrative
0 commentsusers have commented on this narrative
0 likesusers have liked this narrative
Popular Narratives
TH


TheWallstreetKing on MicroVision ·
MicroVision will explode future revenue by 380.37% with a vision towards success
Fair Value:US$6098.6% undervalued
112 followersusers have followed this narrative
11 commentsusers have commented on this narrative
22 likesusers have liked this narrative
AN


AnalystConsensusTarget on NVIDIA ·
NVDA: Expanding AI Demand Will Drive Major Data Center Investments Through 2026
Fair Value:US$250.3927.5% undervalued
951 followersusers have followed this narrative
6 commentsusers have commented on this narrative
25 likesusers have liked this narrative
OS

oscargarcia on Alphabet ·
The company that turned a verb into a global necessity and basically runs the modern internet, digital ads, smartphones, maps, and AI.
Fair Value:US$3407.1% undervalued
148 followersusers have followed this narrative
6 commentsusers have commented on this narrative
18 likesusers have liked this narrative

