
When researching a stock for investment, what can tell us that the company is in decline? Typically, we'll see the trend of both return on capital employed (ROCE) declining and this usually coincides with a decreasing amount of capital employed. Trends like this ultimately mean the business is reducing its investments and also earning less on what it has invested. And from a first read, things don't look too good at T.T (NSE:TTL), so let's see why.
Understanding Return On Capital Employed (ROCE)
Just to clarify if you're unsure, ROCE is a metric for evaluating how much pre-tax income (in percentage terms) a company earns on the capital invested in its business. Analysts use this formula to calculate it for T.T:
Return on Capital Employed = Earnings Before Interest and Tax (EBIT) ÷ (Total Assets - Current Liabilities)
0.07 = ₹87m ÷ (₹2.3b - ₹1.0b) (Based on the trailing twelve months to December 2023).
Thus, T.T has an ROCE of 7.0%. Ultimately, that's a low return and it under-performs the Luxury industry average of 11%.
Check out our latest analysis for T.T
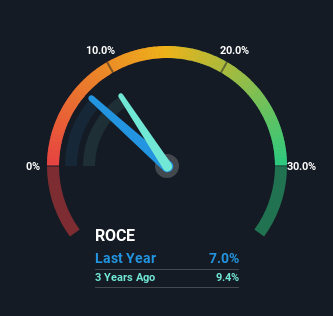
While the past is not representative of the future, it can be helpful to know how a company has performed historically, which is why we have this chart above. If you want to delve into the historical earnings , check out these free graphs detailing revenue and cash flow performance of T.T.
What Can We Tell From T.T's ROCE Trend?
The trend of returns that T.T is generating are raising some concerns. The company used to generate 9.8% on its capital five years ago but it has since fallen noticeably. On top of that, the business is utilizing 45% less capital within its operations. The combination of lower ROCE and less capital employed can indicate that a business is likely to be facing some competitive headwinds or seeing an erosion to its moat. Typically businesses that exhibit these characteristics aren't the ones that tend to multiply over the long term, because statistically speaking, they've already gone through the growth phase of their life cycle.
Another thing to note, T.T has a high ratio of current liabilities to total assets of 45%. This can bring about some risks because the company is basically operating with a rather large reliance on its suppliers or other sorts of short-term creditors. While it's not necessarily a bad thing, it can be beneficial if this ratio is lower.
What We Can Learn From T.T's ROCE
In summary, it's unfortunate that T.T is shrinking its capital base and also generating lower returns. Yet despite these poor fundamentals, the stock has gained a huge 132% over the last five years, so investors appear very optimistic. In any case, the current underlying trends don't bode well for long term performance so unless they reverse, we'd start looking elsewhere.
T.T does have some risks, we noticed 3 warning signs (and 2 which make us uncomfortable) we think you should know about.
For those who like to invest in solid companies, check out this free list of companies with solid balance sheets and high returns on equity.
The New Payments ETF Is Live on NASDAQ:
Money is moving to real-time rails, and a newly listed ETF now gives investors direct exposure. Fast settlement. Institutional custody. Simple access.
Explore how this launch could reshape portfolios
Sponsored ContentValuation is complex, but we're here to simplify it.
Discover if T.T might be undervalued or overvalued with our detailed analysis, featuring fair value estimates, potential risks, dividends, insider trades, and its financial condition.
Access Free AnalysisHave feedback on this article? Concerned about the content? Get in touch with us directly. Alternatively, email editorial-team (at) simplywallst.com.
This article by Simply Wall St is general in nature. We provide commentary based on historical data and analyst forecasts only using an unbiased methodology and our articles are not intended to be financial advice. It does not constitute a recommendation to buy or sell any stock, and does not take account of your objectives, or your financial situation. We aim to bring you long-term focused analysis driven by fundamental data. Note that our analysis may not factor in the latest price-sensitive company announcements or qualitative material. Simply Wall St has no position in any stocks mentioned.
About NSEI:TTL
T.T
Engages in the manufacture and sale of textile products in India and Vietnam.
Mediocre balance sheet with low risk.
Similar Companies
Market Insights

Weekly Picks

THE KINGDOM OF BROWN GOODS: WHY MGPI IS BEING CRUSHED BY INVENTORY & PRIMED FOR RESURRECTION


Why Vertical Aerospace (NYSE: EVTL) is Worth Possibly Over 13x its Current Price


The Quiet Giant That Became AI’s Power Grid
Recently Updated Narratives


MINISO's fair value is projected at 26.69 with an anticipated PE ratio shift of 20x

Fiverr International will transform the freelance industry with AI-powered growth

Stride Stock: Online Education Finds Its Second Act
Popular Narratives


MicroVision will explode future revenue by 380.37% with a vision towards success


Crazy Undervalued 42 Baggers Silver Play (Active & Running Mine)


