
Advertisement
Here's Why TCNS Clothing (NSE:TCNSBRANDS) Can Afford Some Debt

Legendary fund manager Li Lu (who Charlie Munger backed) once said, 'The biggest investment risk is not the volatility of prices, but whether you will suffer a permanent loss of capital.' So it seems the smart money knows that debt - which is usually involved in bankruptcies - is a very important factor, when you assess how risky a company is. We can see that TCNS Clothing Co. Limited (NSE:TCNSBRANDS) does use debt in its business. But the real question is whether this debt is making the company risky.
When Is Debt A Problem?
Generally speaking, debt only becomes a real problem when a company can't easily pay it off, either by raising capital or with its own cash flow. Ultimately, if the company can't fulfill its legal obligations to repay debt, shareholders could walk away with nothing. However, a more usual (but still expensive) situation is where a company must dilute shareholders at a cheap share price simply to get debt under control. Having said that, the most common situation is where a company manages its debt reasonably well - and to its own advantage. When we think about a company's use of debt, we first look at cash and debt together.
See our latest analysis for TCNS Clothing
What Is TCNS Clothing's Debt?
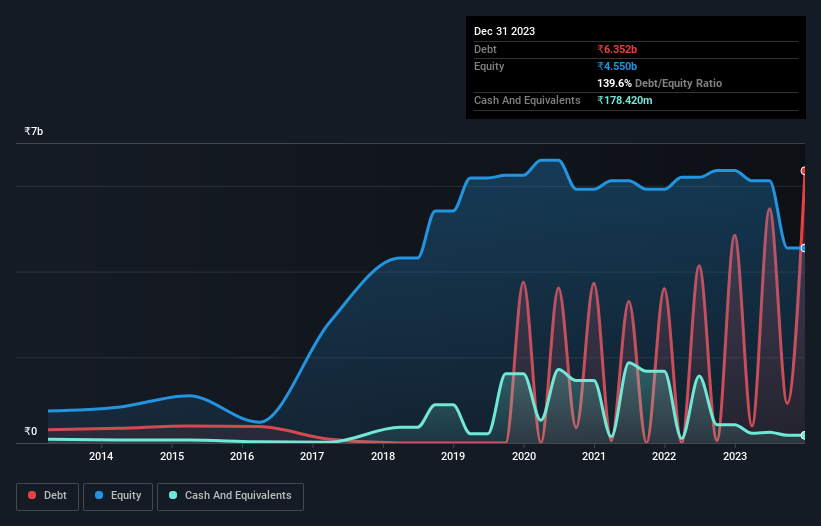
You can click the graphic below for the historical numbers, but it shows that as of September 2023 TCNS Clothing had ₹6.35b of debt, an increase on ₹4.85b, over one year. On the flip side, it has ₹178.4m in cash leading to net debt of about ₹6.17b.
How Healthy Is TCNS Clothing's Balance Sheet?
We can see from the most recent balance sheet that TCNS Clothing had liabilities of ₹5.55b falling due within a year, and liabilities of ₹4.81b due beyond that. Offsetting these obligations, it had cash of ₹178.4m as well as receivables valued at ₹2.33b due within 12 months. So it has liabilities totalling ₹7.86b more than its cash and near-term receivables, combined.
TCNS Clothing has a market capitalization of ₹21.3b, so it could very likely raise cash to ameliorate its balance sheet, if the need arose. But it's clear that we should definitely closely examine whether it can manage its debt without dilution. When analysing debt levels, the balance sheet is the obvious place to start. But ultimately the future profitability of the business will decide if TCNS Clothing can strengthen its balance sheet over time. So if you're focused on the future you can check out this free report showing analyst profit forecasts.
Over 12 months, TCNS Clothing made a loss at the EBIT level, and saw its revenue drop to ₹10b, which is a fall of 13%. That's not what we would hope to see.
Caveat Emptor
While TCNS Clothing's falling revenue is about as heartwarming as a wet blanket, arguably its earnings before interest and tax (EBIT) loss is even less appealing. Indeed, it lost a very considerable ₹2.7b at the EBIT level. Considering that alongside the liabilities mentioned above does not give us much confidence that company should be using so much debt. Quite frankly we think the balance sheet is far from match-fit, although it could be improved with time. For example, we would not want to see a repeat of last year's loss of ₹2.5b. So to be blunt we do think it is risky. There's no doubt that we learn most about debt from the balance sheet. But ultimately, every company can contain risks that exist outside of the balance sheet. Be aware that TCNS Clothing is showing 3 warning signs in our investment analysis , and 2 of those don't sit too well with us...
At the end of the day, it's often better to focus on companies that are free from net debt. You can access our special list of such companies (all with a track record of profit growth). It's free.
Valuation is complex, but we're here to simplify it.
Discover if TCNS Clothing might be undervalued or overvalued with our detailed analysis, featuring fair value estimates, potential risks, dividends, insider trades, and its financial condition.
Access Free AnalysisHave feedback on this article? Concerned about the content? Get in touch with us directly. Alternatively, email editorial-team (at) simplywallst.com.
This article by Simply Wall St is general in nature. We provide commentary based on historical data and analyst forecasts only using an unbiased methodology and our articles are not intended to be financial advice. It does not constitute a recommendation to buy or sell any stock, and does not take account of your objectives, or your financial situation. We aim to bring you long-term focused analysis driven by fundamental data. Note that our analysis may not factor in the latest price-sensitive company announcements or qualitative material. Simply Wall St has no position in any stocks mentioned.
About NSEI:TCNSBRANDS
TCNS Clothing
Designs, manufactures, markets, and retails women's apparel and accessories in India and internationally.
Adequate balance sheet minimal.
Similar Companies
Market Insights

Advertisement
Community Narratives
Scaling up in building materials with smart M&A and growing profitability
Fair Value US$2.77|30.0% undervalued
CM
Community Contributor
Hims: The Platform Powering Personalised Healthcare
Fair Value US$114.01|51.9% undervalued
BL
Community Contributor
Undervalued lottery company with strong fundamentals
Fair Value AU$15.00|34.5% undervalued
RO
Community Contributor
Proximus, transferring money from the impatient to the patient investor
Fair Value €16.62|55.1% undervalued
AX
Community Contributor