- India
- /
- Consumer Durables
- /
- NSEI:SYMPHONY
Symphony (NSE:SYMPHONY) jumps 10% this week, though earnings growth is still tracking behind one-year shareholder returns


The most you can lose on any stock (assuming you don't use leverage) is 100% of your money. On the other hand, if you find a high quality business to buy (at the right price) you can more than double your money! For example, the Symphony Limited (NSE:SYMPHONY) share price has soared 110% return in just a single year. It's also good to see the share price up 63% over the last quarter. Also impressive, the stock is up 70% over three years, making long term shareholders happy, too.
Since the stock has added ₹12b to its market cap in the past week alone, let's see if underlying performance has been driving long-term returns.
Check out our latest analysis for Symphony
There is no denying that markets are sometimes efficient, but prices do not always reflect underlying business performance. By comparing earnings per share (EPS) and share price changes over time, we can get a feel for how investor attitudes to a company have morphed over time.
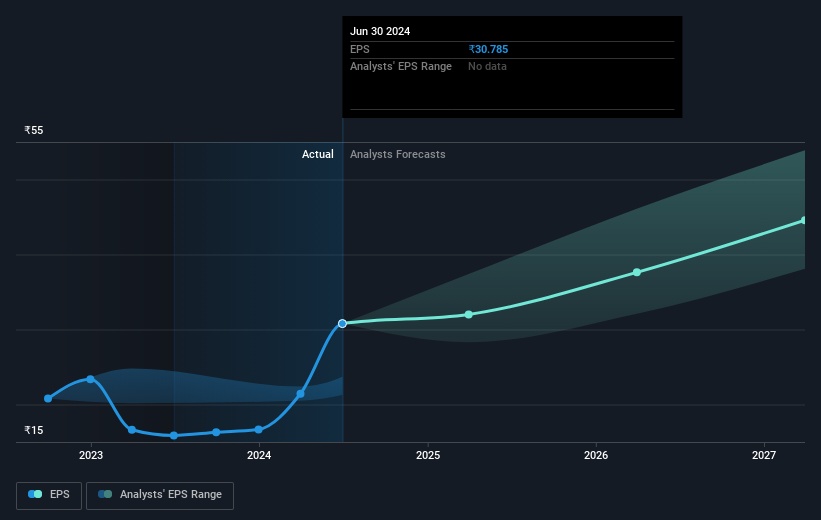
During the last year Symphony grew its earnings per share (EPS) by 94%. We note that the earnings per share growth isn't far from the share price growth (of 110%). That suggests that the market sentiment around the company hasn't changed much over that time. We don't think its coincidental that the share price is growing at a similar rate to the earnings per share.
The image below shows how EPS has tracked over time (if you click on the image you can see greater detail).
We know that Symphony has improved its bottom line lately, but is it going to grow revenue? If you're interested, you could check this free report showing consensus revenue forecasts.
What About Dividends?
It is important to consider the total shareholder return, as well as the share price return, for any given stock. The TSR is a return calculation that accounts for the value of cash dividends (assuming that any dividend received was reinvested) and the calculated value of any discounted capital raisings and spin-offs. It's fair to say that the TSR gives a more complete picture for stocks that pay a dividend. As it happens, Symphony's TSR for the last 1 year was 113%, which exceeds the share price return mentioned earlier. The dividends paid by the company have thusly boosted the total shareholder return.
A Different Perspective
It's good to see that Symphony has rewarded shareholders with a total shareholder return of 113% in the last twelve months. And that does include the dividend. That gain is better than the annual TSR over five years, which is 9%. Therefore it seems like sentiment around the company has been positive lately. Someone with an optimistic perspective could view the recent improvement in TSR as indicating that the business itself is getting better with time. It's always interesting to track share price performance over the longer term. But to understand Symphony better, we need to consider many other factors. For example, we've discovered 2 warning signs for Symphony that you should be aware of before investing here.
Of course, you might find a fantastic investment by looking elsewhere. So take a peek at this free list of companies we expect will grow earnings.
Please note, the market returns quoted in this article reflect the market weighted average returns of stocks that currently trade on Indian exchanges.
If you're looking to trade Symphony, open an account with the lowest-cost platform trusted by professionals, Interactive Brokers.
With clients in over 200 countries and territories, and access to 160 markets, IBKR lets you trade stocks, options, futures, forex, bonds and funds from a single integrated account.
Enjoy no hidden fees, no account minimums, and FX conversion rates as low as 0.03%, far better than what most brokers offer.
Sponsored ContentNew: Manage All Your Stock Portfolios in One Place
We've created the ultimate portfolio companion for stock investors, and it's free.
• Connect an unlimited number of Portfolios and see your total in one currency
• Be alerted to new Warning Signs or Risks via email or mobile
• Track the Fair Value of your stocks
Have feedback on this article? Concerned about the content? Get in touch with us directly. Alternatively, email editorial-team (at) simplywallst.com.
This article by Simply Wall St is general in nature. We provide commentary based on historical data and analyst forecasts only using an unbiased methodology and our articles are not intended to be financial advice. It does not constitute a recommendation to buy or sell any stock, and does not take account of your objectives, or your financial situation. We aim to bring you long-term focused analysis driven by fundamental data. Note that our analysis may not factor in the latest price-sensitive company announcements or qualitative material. Simply Wall St has no position in any stocks mentioned.
About NSEI:SYMPHONY
Symphony
Manufactures and trades in residential, commercial, and industrial air coolers and other appliances in India and internationally.
Outstanding track record with flawless balance sheet and pays a dividend.
Similar Companies
Market Insights

Community Narratives


