Some Investors May Be Worried About Superhouse's (NSE:SUPERHOUSE) Returns On Capital


What trends should we look for it we want to identify stocks that can multiply in value over the long term? Amongst other things, we'll want to see two things; firstly, a growing return on capital employed (ROCE) and secondly, an expansion in the company's amount of capital employed. This shows us that it's a compounding machine, able to continually reinvest its earnings back into the business and generate higher returns. Although, when we looked at Superhouse (NSE:SUPERHOUSE), it didn't seem to tick all of these boxes.
Understanding Return On Capital Employed (ROCE)
For those who don't know, ROCE is a measure of a company's yearly pre-tax profit (its return), relative to the capital employed in the business. The formula for this calculation on Superhouse is:
Return on Capital Employed = Earnings Before Interest and Tax (EBIT) ÷ (Total Assets - Current Liabilities)
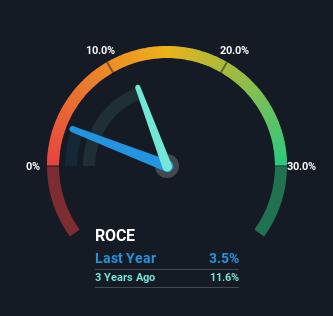
0.035 = ₹185m ÷ (₹8.9b - ₹3.7b) (Based on the trailing twelve months to September 2024).
So, Superhouse has an ROCE of 3.5%. In absolute terms, that's a low return and it also under-performs the Luxury industry average of 11%.
View our latest analysis for Superhouse
While the past is not representative of the future, it can be helpful to know how a company has performed historically, which is why we have this chart above. If you're interested in investigating Superhouse's past further, check out this free graph covering Superhouse's past earnings, revenue and cash flow.
What Does the ROCE Trend For Superhouse Tell Us?
On the surface, the trend of ROCE at Superhouse doesn't inspire confidence. Around five years ago the returns on capital were 9.7%, but since then they've fallen to 3.5%. And considering revenue has dropped while employing more capital, we'd be cautious. This could mean that the business is losing its competitive advantage or market share, because while more money is being put into ventures, it's actually producing a lower return - "less bang for their buck" per se.
On a separate but related note, it's important to know that Superhouse has a current liabilities to total assets ratio of 42%, which we'd consider pretty high. This effectively means that suppliers (or short-term creditors) are funding a large portion of the business, so just be aware that this can introduce some elements of risk. Ideally we'd like to see this reduce as that would mean fewer obligations bearing risks.
What We Can Learn From Superhouse's ROCE
In summary, we're somewhat concerned by Superhouse's diminishing returns on increasing amounts of capital. The market must be rosy on the stock's future because even though the underlying trends aren't too encouraging, the stock has soared 149%. In any case, the current underlying trends don't bode well for long term performance so unless they reverse, we'd start looking elsewhere.
If you want to know some of the risks facing Superhouse we've found 4 warning signs (1 is significant!) that you should be aware of before investing here.
While Superhouse may not currently earn the highest returns, we've compiled a list of companies that currently earn more than 25% return on equity. Check out this free list here.
If you're looking to trade Superhouse, open an account with the lowest-cost platform trusted by professionals, Interactive Brokers.
With clients in over 200 countries and territories, and access to 160 markets, IBKR lets you trade stocks, options, futures, forex, bonds and funds from a single integrated account.
Enjoy no hidden fees, no account minimums, and FX conversion rates as low as 0.03%, far better than what most brokers offer.
Sponsored ContentNew: Manage All Your Stock Portfolios in One Place
We've created the ultimate portfolio companion for stock investors, and it's free.
• Connect an unlimited number of Portfolios and see your total in one currency
• Be alerted to new Warning Signs or Risks via email or mobile
• Track the Fair Value of your stocks
Have feedback on this article? Concerned about the content? Get in touch with us directly. Alternatively, email editorial-team (at) simplywallst.com.
This article by Simply Wall St is general in nature. We provide commentary based on historical data and analyst forecasts only using an unbiased methodology and our articles are not intended to be financial advice. It does not constitute a recommendation to buy or sell any stock, and does not take account of your objectives, or your financial situation. We aim to bring you long-term focused analysis driven by fundamental data. Note that our analysis may not factor in the latest price-sensitive company announcements or qualitative material. Simply Wall St has no position in any stocks mentioned.
About NSEI:SUPERHOUSE
Superhouse
Engages in the manufacture and sale of leather and leather products, and textile garments in India and internationally.
Adequate balance sheet slight.
Market Insights

Community Narratives


