
Advertisement
Investors Still Aren't Entirely Convinced By Shekhawati Poly-Yarn Limited's (NSE:SPYL) Revenues Despite 29% Price Jump
Shekhawati Poly-Yarn Limited (NSE:SPYL) shares have continued their recent momentum with a 29% gain in the last month alone. The last 30 days were the cherry on top of the stock's 570% gain in the last year, which is nothing short of spectacular.
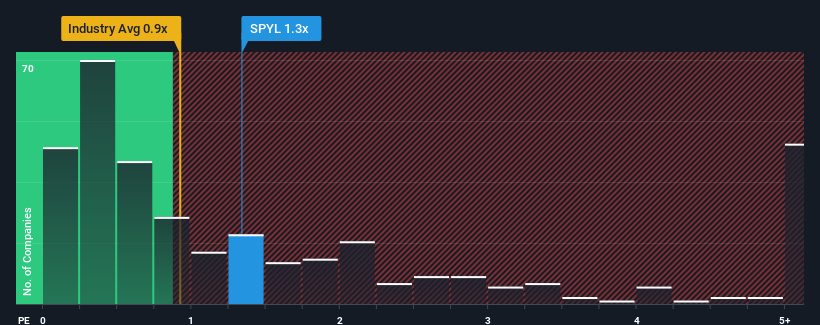
Although its price has surged higher, there still wouldn't be many who think Shekhawati Poly-Yarn's price-to-sales (or "P/S") ratio of 1.3x is worth a mention when the median P/S in India's Luxury industry is similar at about 0.9x. However, investors might be overlooking a clear opportunity or potential setback if there is no rational basis for the P/S.
See our latest analysis for Shekhawati Poly-Yarn
How Shekhawati Poly-Yarn Has Been Performing
As an illustration, revenue has deteriorated at Shekhawati Poly-Yarn over the last year, which is not ideal at all. Perhaps investors believe the recent revenue performance is enough to keep in line with the industry, which is keeping the P/S from dropping off. If not, then existing shareholders may be a little nervous about the viability of the share price.
Want the full picture on earnings, revenue and cash flow for the company? Then our free report on Shekhawati Poly-Yarn will help you shine a light on its historical performance.Do Revenue Forecasts Match The P/S Ratio?
There's an inherent assumption that a company should be matching the industry for P/S ratios like Shekhawati Poly-Yarn's to be considered reasonable.
In reviewing the last year of financials, we were disheartened to see the company's revenues fell to the tune of 78%. Still, the latest three year period has seen an excellent 109% overall rise in revenue, in spite of its unsatisfying short-term performance. Accordingly, while they would have preferred to keep the run going, shareholders would definitely welcome the medium-term rates of revenue growth.
This is in contrast to the rest of the industry, which is expected to grow by 11% over the next year, materially lower than the company's recent medium-term annualised growth rates.
In light of this, it's curious that Shekhawati Poly-Yarn's P/S sits in line with the majority of other companies. It may be that most investors are not convinced the company can maintain its recent growth rates.
What We Can Learn From Shekhawati Poly-Yarn's P/S?
Its shares have lifted substantially and now Shekhawati Poly-Yarn's P/S is back within range of the industry median. Generally, our preference is to limit the use of the price-to-sales ratio to establishing what the market thinks about the overall health of a company.
We didn't quite envision Shekhawati Poly-Yarn's P/S sitting in line with the wider industry, considering the revenue growth over the last three-year is higher than the current industry outlook. When we see strong revenue with faster-than-industry growth, we can only assume potential risks are what might be placing pressure on the P/S ratio. At least the risk of a price drop looks to be subdued if recent medium-term revenue trends continue, but investors seem to think future revenue could see some volatility.
And what about other risks? Every company has them, and we've spotted 3 warning signs for Shekhawati Poly-Yarn (of which 2 can't be ignored!) you should know about.
Of course, profitable companies with a history of great earnings growth are generally safer bets. So you may wish to see this free collection of other companies that have reasonable P/E ratios and have grown earnings strongly.
New: Manage All Your Stock Portfolios in One Place
We've created the ultimate portfolio companion for stock investors, and it's free.
• Connect an unlimited number of Portfolios and see your total in one currency
• Be alerted to new Warning Signs or Risks via email or mobile
• Track the Fair Value of your stocks
Have feedback on this article? Concerned about the content? Get in touch with us directly. Alternatively, email editorial-team (at) simplywallst.com.
This article by Simply Wall St is general in nature. We provide commentary based on historical data and analyst forecasts only using an unbiased methodology and our articles are not intended to be financial advice. It does not constitute a recommendation to buy or sell any stock, and does not take account of your objectives, or your financial situation. We aim to bring you long-term focused analysis driven by fundamental data. Note that our analysis may not factor in the latest price-sensitive company announcements or qualitative material. Simply Wall St has no position in any stocks mentioned.
About NSEI:SHEKHAWATI
Shekhawati Industries
Manufactures polyester and nylon draw textured yarn, twisted yarn, and knitted fabrics in India.
Excellent balance sheet with acceptable track record.
Market Insights

Advertisement
Community Narratives
Kodiak AI - a potential 100 bagger opportunity?
Fair Value US$14.00|44.7% undervalued
DA
Community Contributor
A Fair Price for a Great Business Facing Real Threats
Fair Value US$383.06|13.0% undervalued
IM
Community Contributor
AXON And Shopify Integration Will Unlock Global Mobile Advertising
Fair Value US$646.30|0% overvalued
AN
Based on Analyst Price Targets