Advertisement
These 4 Measures Indicate That Precot (NSE:PRECOT) Is Using Debt Extensively
Legendary fund manager Li Lu (who Charlie Munger backed) once said, 'The biggest investment risk is not the volatility of prices, but whether you will suffer a permanent loss of capital.' When we think about how risky a company is, we always like to look at its use of debt, since debt overload can lead to ruin. We note that Precot Limited (NSE:PRECOT) does have debt on its balance sheet. But the more important question is: how much risk is that debt creating?
What Risk Does Debt Bring?
Debt and other liabilities become risky for a business when it cannot easily fulfill those obligations, either with free cash flow or by raising capital at an attractive price. In the worst case scenario, a company can go bankrupt if it cannot pay its creditors. While that is not too common, we often do see indebted companies permanently diluting shareholders because lenders force them to raise capital at a distressed price. Of course, plenty of companies use debt to fund growth, without any negative consequences. When we examine debt levels, we first consider both cash and debt levels, together.
What Is Precot's Debt?
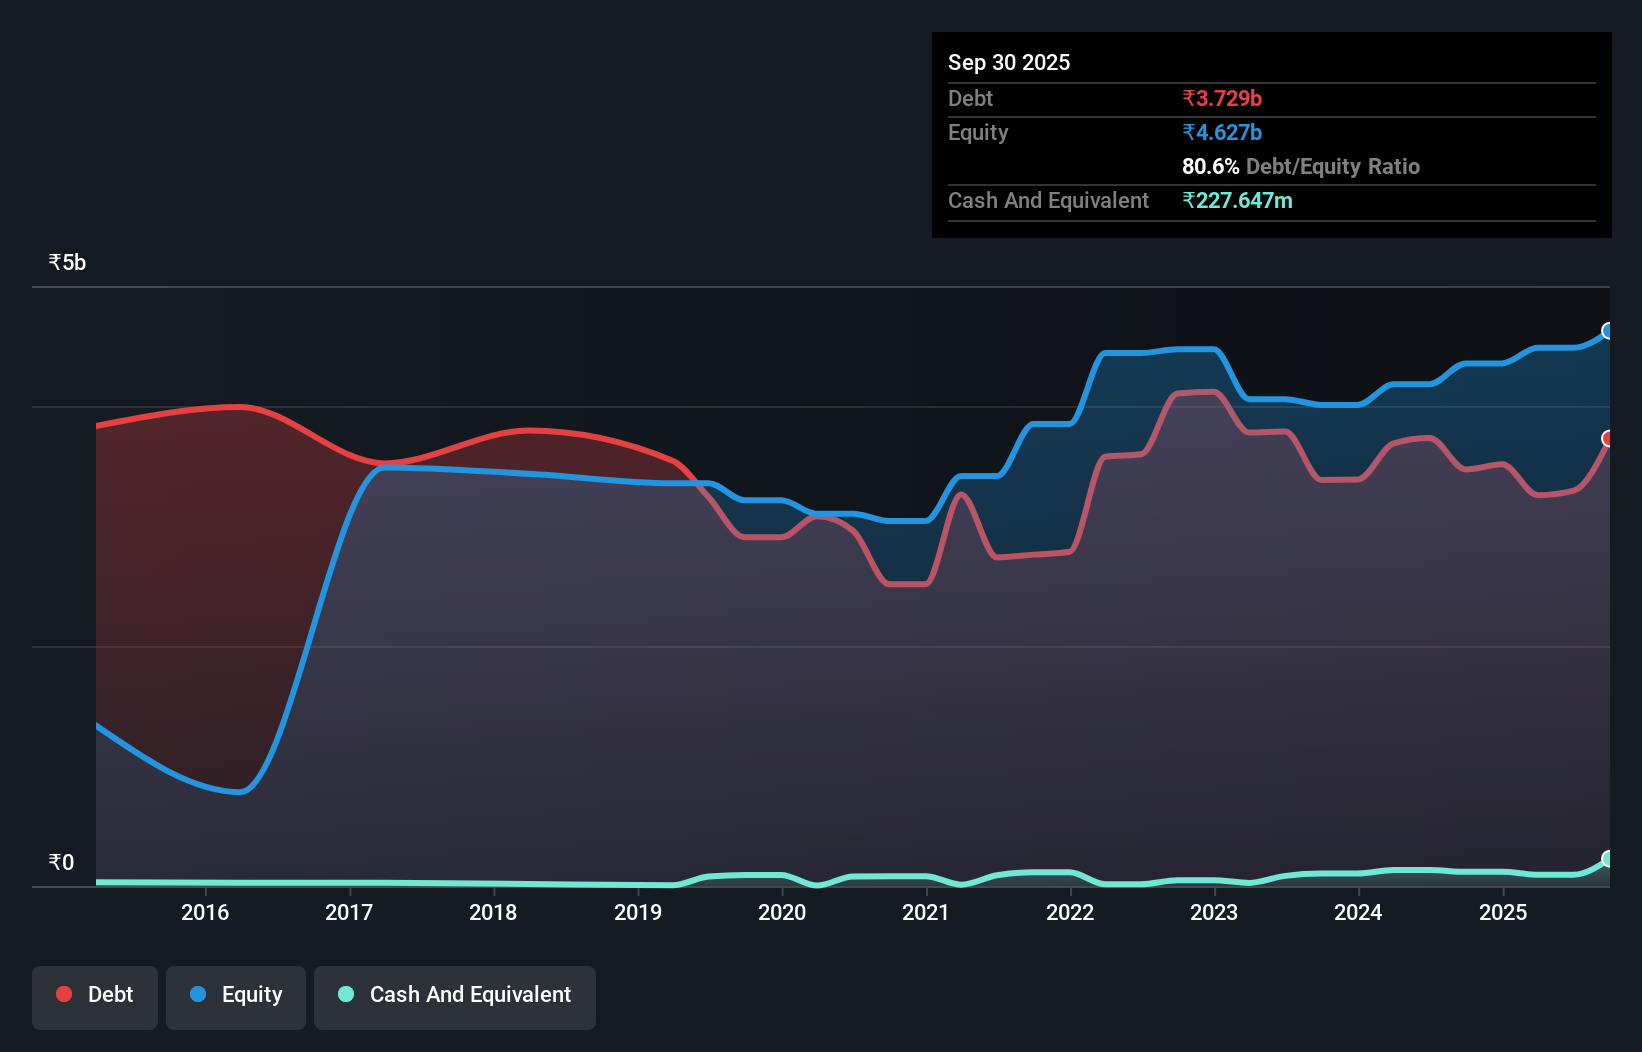
The image below, which you can click on for greater detail, shows that at September 2025 Precot had debt of ₹3.73b, up from ₹3.47b in one year. On the flip side, it has ₹227.6m in cash leading to net debt of about ₹3.50b.
How Healthy Is Precot's Balance Sheet?
Zooming in on the latest balance sheet data, we can see that Precot had liabilities of ₹3.62b due within 12 months and liabilities of ₹1.12b due beyond that. Offsetting these obligations, it had cash of ₹227.6m as well as receivables valued at ₹1.08b due within 12 months. So it has liabilities totalling ₹3.44b more than its cash and near-term receivables, combined.
This is a mountain of leverage relative to its market capitalization of ₹3.97b. Should its lenders demand that it shore up the balance sheet, shareholders would likely face severe dilution.
See our latest analysis for Precot
In order to size up a company's debt relative to its earnings, we calculate its net debt divided by its earnings before interest, tax, depreciation, and amortization (EBITDA) and its earnings before interest and tax (EBIT) divided by its interest expense (its interest cover). This way, we consider both the absolute quantum of the debt, as well as the interest rates paid on it.
Precot has a debt to EBITDA ratio of 3.2 and its EBIT covered its interest expense 3.3 times. This suggests that while the debt levels are significant, we'd stop short of calling them problematic. On a lighter note, we note that Precot grew its EBIT by 21% in the last year. If sustained, this growth should make that debt evaporate like a scarce drinking water during an unnaturally hot summer. The balance sheet is clearly the area to focus on when you are analysing debt. But you can't view debt in total isolation; since Precot will need earnings to service that debt. So if you're keen to discover more about its earnings, it might be worth checking out this graph of its long term earnings trend.
Finally, a business needs free cash flow to pay off debt; accounting profits just don't cut it. So we clearly need to look at whether that EBIT is leading to corresponding free cash flow. Looking at the most recent two years, Precot recorded free cash flow of 25% of its EBIT, which is weaker than we'd expect. That weak cash conversion makes it more difficult to handle indebtedness.
Our View
Precot's interest cover and level of total liabilities definitely weigh on it, in our esteem. But the good news is it seems to be able to grow its EBIT with ease. Taking the abovementioned factors together we do think Precot's debt poses some risks to the business. So while that leverage does boost returns on equity, we wouldn't really want to see it increase from here. When analysing debt levels, the balance sheet is the obvious place to start. But ultimately, every company can contain risks that exist outside of the balance sheet. To that end, you should learn about the 4 warning signs we've spotted with Precot (including 1 which makes us a bit uncomfortable) .
At the end of the day, it's often better to focus on companies that are free from net debt. You can access our special list of such companies (all with a track record of profit growth). It's free.
New: Manage All Your Stock Portfolios in One Place
We've created the ultimate portfolio companion for stock investors, and it's free.
• Connect an unlimited number of Portfolios and see your total in one currency
• Be alerted to new Warning Signs or Risks via email or mobile
• Track the Fair Value of your stocks
Have feedback on this article? Concerned about the content? Get in touch with us directly. Alternatively, email editorial-team (at) simplywallst.com.
This article by Simply Wall St is general in nature. We provide commentary based on historical data and analyst forecasts only using an unbiased methodology and our articles are not intended to be financial advice. It does not constitute a recommendation to buy or sell any stock, and does not take account of your objectives, or your financial situation. We aim to bring you long-term focused analysis driven by fundamental data. Note that our analysis may not factor in the latest price-sensitive company announcements or qualitative material. Simply Wall St has no position in any stocks mentioned.
About NSEI:PRECOT
Precot
Manufactures and sells yarn and technical textile products in India and internationally.
Moderate risk with adequate balance sheet.
Similar Companies
Market Insights


Advertisement
Weekly Picks
CE


Ceazar on Sparc AI ·
When GPS fails: this small cap is fixing a $54B drone problem
Fair Value:CA$5.2552.0% undervalued
133 followersusers have followed this narrative
0 commentsusers have commented on this narrative
26 likesusers have liked this narrative
BL


BlackGoat on IREN ·
IREN's Bold Moves in Sustainable Bitcoin Mining & AI Data Centers
Fair Value:US$71.4848.5% undervalued
227 followersusers have followed this narrative
10 commentsusers have commented on this narrative
33 likesusers have liked this narrative
HE


HedgeY on Arm Holdings ·
The Architecture Layer of AI Computing - But Priced Like the Future Already Arrived?
Fair Value:US$43044.3% undervalued
27 followersusers have followed this narrative
1 commentusers have commented on this narrative
8 likesusers have liked this narrative
HI


Hidden_Rock_Capital on Fiserv ·
Temporary "perfect storm" leads to opportunity to buy financial services leader for less than 5x long-term earnings
Fair Value:US$119.9955.0% undervalued
37 followersusers have followed this narrative
1 commentusers have commented on this narrative
11 likesusers have liked this narrative
Recently Updated Narratives
JU

julio on FIGS ·
Figs valuation
Fair Value:US$14.3925.6% undervalued
23 followersusers have followed this narrative
0 commentsusers have commented on this narrative
0 likesusers have liked this narrative
FU

FundamentalFlow on Vertiv Holdings Co ·
The Short and Long Term Compounder of Liquid Cooling industry.
Fair Value:US$45046.3% undervalued
2 followersusers have followed this narrative
0 commentsusers have commented on this narrative
0 likesusers have liked this narrative
PI


PittTheYounger on Balfour Beatty ·
Balfour Beatty to profit from govt's drive for growth
Fair Value:UK£9.135.5% undervalued
9 followersusers have followed this narrative
1 commentusers have commented on this narrative
0 likesusers have liked this narrative
Popular Narratives
OS


oscargarcia on NVIDIA ·
The company that went from selling GPUs to gamers to becoming the AI arms dealer of the 21st century.
Fair Value:US$28028.3% undervalued
234 followersusers have followed this narrative
9 commentsusers have commented on this narrative
16 likesusers have liked this narrative
CU

CubanEros on Microsoft ·
A wonderful business at reasonable price.
Fair Value:US$419.9110.7% overvalued
110 followersusers have followed this narrative
0 commentsusers have commented on this narrative
7 likesusers have liked this narrative
TR


tripledub on Alphabet ·
Warren Buffett Just Bet $10 Billion on Google. The Catch? You May Already Be Too Late.
Fair Value:US$202.6275.8% overvalued
125 followersusers have followed this narrative
1 commentusers have commented on this narrative
18 likesusers have liked this narrative
Trending Discussion
GR
greg_xasak on Fiserv ·
As someone who has dealt directly with them as a CTO for a credit union, I have 8 years of horror stories about doing business with them. If there was any other competitor than could deliver 80% of Fiserv services, there would be a mad rush to migrate to them. They should thank their lucky stars they are a near monopoly. this industry is so ripe for a well funded competitor. Their integration of technology is awful, their ability to fix their own implementation screwups is sadly tragic. Sometimes they just silently kill support tickets without resolution and you never find out until you do a follow up inquiry. Why, because sometimes no one you are dealing with knows how to fix it and knows no one to ask for help. They can not meet their own implementation deadlines and sometimes there is no one on a technical team dealing with you that has any banking or credit union experience. The is an industry insider phrase when you meet other Fiserv customers called being "Fiserved". It means telling others of your worst stories of dealing with them. Ask around, all CTO's have some doozies.
2
|0
FU

FundamentalFlow on Green Tea Group ·
Great narrative! Many people focus on AI nowadays (including me), and it's refreshing to see a deep dive into the fundamentals of a business like Green Tea. I really appreciate how you cut through the market noise to focus on the unit economics and the structural risks.I also write from a fundamentals-first perspective, and I'm currently working on an analysis of Samsung Electronics. I've been trying to refine how I balance factors such as financial health, future, and valuation of a company.If you have a moment, I'd love for you to take a look at my narritives. I'd value your perspective on whether my analysis holds up to the level of rigor you set here. No pressure at all, but I'd appreciate the feedback if you're open to it!
1
|0
