Indo Rama Synthetics (India) Limited (NSE:INDORAMA) Shares Fly 33% But Investors Aren't Buying For Growth


Indo Rama Synthetics (India) Limited (NSE:INDORAMA) shareholders would be excited to see that the share price has had a great month, posting a 33% gain and recovering from prior weakness. Unfortunately, despite the strong performance over the last month, the full year gain of 9.0% isn't as attractive.
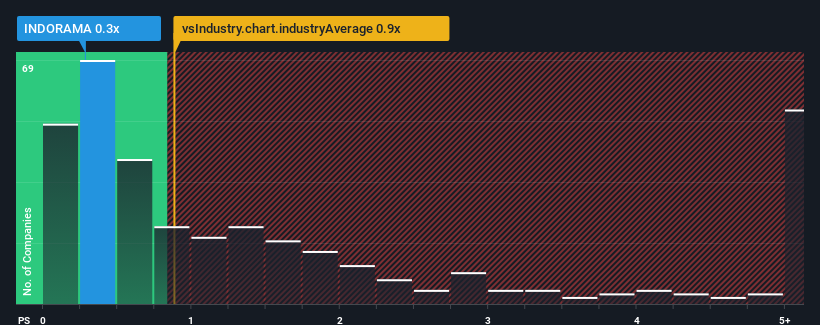
Although its price has surged higher, Indo Rama Synthetics (India) may still be sending buy signals at present with its price-to-sales (or "P/S") ratio of 0.3x, considering almost half of all companies in the Luxury industry in India have P/S ratios greater than 0.9x and even P/S higher than 3x aren't out of the ordinary. Nonetheless, we'd need to dig a little deeper to determine if there is a rational basis for the reduced P/S.
We've discovered 2 warning signs about Indo Rama Synthetics (India). View them for free.View our latest analysis for Indo Rama Synthetics (India)
What Does Indo Rama Synthetics (India)'s Recent Performance Look Like?
Revenue has risen firmly for Indo Rama Synthetics (India) recently, which is pleasing to see. It might be that many expect the respectable revenue performance to degrade substantially, which has repressed the P/S. If you like the company, you'd be hoping this isn't the case so that you could potentially pick up some stock while it's out of favour.
Want the full picture on earnings, revenue and cash flow for the company? Then our free report on Indo Rama Synthetics (India) will help you shine a light on its historical performance.What Are Revenue Growth Metrics Telling Us About The Low P/S?
The only time you'd be truly comfortable seeing a P/S as low as Indo Rama Synthetics (India)'s is when the company's growth is on track to lag the industry.
Retrospectively, the last year delivered a decent 11% gain to the company's revenues. Revenue has also lifted 6.2% in aggregate from three years ago, partly thanks to the last 12 months of growth. Therefore, it's fair to say the revenue growth recently has been respectable for the company.
Comparing that to the industry, which is predicted to deliver 12% growth in the next 12 months, the company's momentum is weaker, based on recent medium-term annualised revenue results.
With this information, we can see why Indo Rama Synthetics (India) is trading at a P/S lower than the industry. Apparently many shareholders weren't comfortable holding on to something they believe will continue to trail the wider industry.
What Does Indo Rama Synthetics (India)'s P/S Mean For Investors?
Despite Indo Rama Synthetics (India)'s share price climbing recently, its P/S still lags most other companies. Generally, our preference is to limit the use of the price-to-sales ratio to establishing what the market thinks about the overall health of a company.
Our examination of Indo Rama Synthetics (India) confirms that the company's revenue trends over the past three-year years are a key factor in its low price-to-sales ratio, as we suspected, given they fall short of current industry expectations. Right now shareholders are accepting the low P/S as they concede future revenue probably won't provide any pleasant surprises. Unless the recent medium-term conditions improve, they will continue to form a barrier for the share price around these levels.
Before you take the next step, you should know about the 2 warning signs for Indo Rama Synthetics (India) (1 is significant!) that we have uncovered.
If companies with solid past earnings growth is up your alley, you may wish to see this free collection of other companies with strong earnings growth and low P/E ratios.
If you're looking to trade Indo Rama Synthetics (India), open an account with the lowest-cost platform trusted by professionals, Interactive Brokers.
With clients in over 200 countries and territories, and access to 160 markets, IBKR lets you trade stocks, options, futures, forex, bonds and funds from a single integrated account.
Enjoy no hidden fees, no account minimums, and FX conversion rates as low as 0.03%, far better than what most brokers offer.
Sponsored ContentNew: AI Stock Screener & Alerts
Our new AI Stock Screener scans the market every day to uncover opportunities.
• Dividend Powerhouses (3%+ Yield)
• Undervalued Small Caps with Insider Buying
• High growth Tech and AI Companies
Or build your own from over 50 metrics.
Have feedback on this article? Concerned about the content? Get in touch with us directly. Alternatively, email editorial-team (at) simplywallst.com.
This article by Simply Wall St is general in nature. We provide commentary based on historical data and analyst forecasts only using an unbiased methodology and our articles are not intended to be financial advice. It does not constitute a recommendation to buy or sell any stock, and does not take account of your objectives, or your financial situation. We aim to bring you long-term focused analysis driven by fundamental data. Note that our analysis may not factor in the latest price-sensitive company announcements or qualitative material. Simply Wall St has no position in any stocks mentioned.
About NSEI:INDORAMA
Indo Rama Synthetics (India)
Trades in and manufactures of polyester products in India, Turkey, Nepal, and internationally.
Good value with acceptable track record.
Similar Companies
Market Insights

Community Narratives


