
Advertisement
What Goldiam International Limited's (NSE:GOLDIAM) 27% Share Price Gain Is Not Telling You

Despite an already strong run, Goldiam International Limited (NSE:GOLDIAM) shares have been powering on, with a gain of 27% in the last thirty days. The annual gain comes to 179% following the latest surge, making investors sit up and take notice.
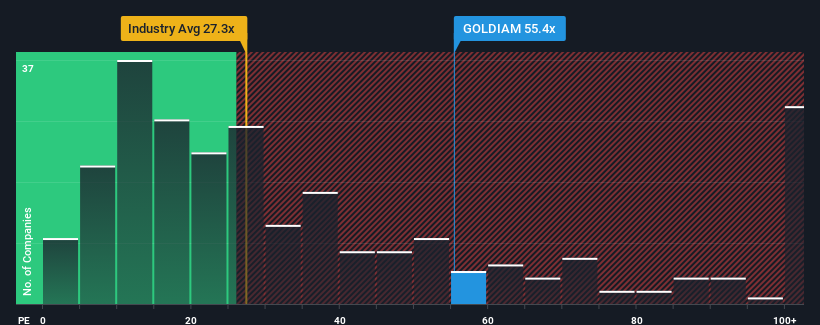
Since its price has surged higher, Goldiam International may be sending very bearish signals at the moment with a price-to-earnings (or "P/E") ratio of 55.4x, since almost half of all companies in India have P/E ratios under 29x and even P/E's lower than 17x are not unusual. Although, it's not wise to just take the P/E at face value as there may be an explanation why it's so lofty.
The earnings growth achieved at Goldiam International over the last year would be more than acceptable for most companies. One possibility is that the P/E is high because investors think this respectable earnings growth will be enough to outperform the broader market in the near future. If not, then existing shareholders may be a little nervous about the viability of the share price.
See our latest analysis for Goldiam International
How Is Goldiam International's Growth Trending?
The only time you'd be truly comfortable seeing a P/E as steep as Goldiam International's is when the company's growth is on track to outshine the market decidedly.
If we review the last year of earnings growth, the company posted a worthy increase of 12%. The solid recent performance means it was also able to grow EPS by 7.8% in total over the last three years. Accordingly, shareholders would have probably been satisfied with the medium-term rates of earnings growth.
This is in contrast to the rest of the market, which is expected to grow by 26% over the next year, materially higher than the company's recent medium-term annualised growth rates.
With this information, we find it concerning that Goldiam International is trading at a P/E higher than the market. Apparently many investors in the company are way more bullish than recent times would indicate and aren't willing to let go of their stock at any price. Only the boldest would assume these prices are sustainable as a continuation of recent earnings trends is likely to weigh heavily on the share price eventually.
The Key Takeaway
Goldiam International's P/E is flying high just like its stock has during the last month. Generally, our preference is to limit the use of the price-to-earnings ratio to establishing what the market thinks about the overall health of a company.
We've established that Goldiam International currently trades on a much higher than expected P/E since its recent three-year growth is lower than the wider market forecast. When we see weak earnings with slower than market growth, we suspect the share price is at risk of declining, sending the high P/E lower. If recent medium-term earnings trends continue, it will place shareholders' investments at significant risk and potential investors in danger of paying an excessive premium.
It's always necessary to consider the ever-present spectre of investment risk. We've identified 4 warning signs with Goldiam International (at least 2 which are a bit unpleasant), and understanding these should be part of your investment process.
Of course, you might also be able to find a better stock than Goldiam International. So you may wish to see this free collection of other companies that have reasonable P/E ratios and have grown earnings strongly.
New: Manage All Your Stock Portfolios in One Place
We've created the ultimate portfolio companion for stock investors, and it's free.
• Connect an unlimited number of Portfolios and see your total in one currency
• Be alerted to new Warning Signs or Risks via email or mobile
• Track the Fair Value of your stocks
Have feedback on this article? Concerned about the content? Get in touch with us directly. Alternatively, email editorial-team (at) simplywallst.com.
This article by Simply Wall St is general in nature. We provide commentary based on historical data and analyst forecasts only using an unbiased methodology and our articles are not intended to be financial advice. It does not constitute a recommendation to buy or sell any stock, and does not take account of your objectives, or your financial situation. We aim to bring you long-term focused analysis driven by fundamental data. Note that our analysis may not factor in the latest price-sensitive company announcements or qualitative material. Simply Wall St has no position in any stocks mentioned.
About NSEI:GOLDIAM
Goldiam International
Manufactures, sells, and trades in diamond studded gold, silver, and platinum jewelry in India.
Flawless balance sheet with solid track record.
Similar Companies
Market Insights

Advertisement
Community Narratives

Apple: A Dying Star with an Overpriced Valuation
Fair Value US$177.34|19.1% overvalued
IN
Community Contributor
Avino a case for USD$20 per share within 5 years (assuming $3,500 gold, $100 silver and $4 copper).
Fair Value CA$26.79|86.0% undervalued
AG
Community Contributor
Riding the Defense Boom RENK Sees Revenue Climb at 15% CAGR by FY 2029
Fair Value €69.87|14.3% undervalued
CH
Community Contributor