
Advertisement
Earnings Working Against Globe Textiles (India) Limited's (NSE:GLOBE) Share Price Following 28% Dive
Globe Textiles (India) Limited (NSE:GLOBE) shareholders that were waiting for something to happen have been dealt a blow with a 28% share price drop in the last month. The drop over the last 30 days has capped off a tough year for shareholders, with the share price down 27% in that time.
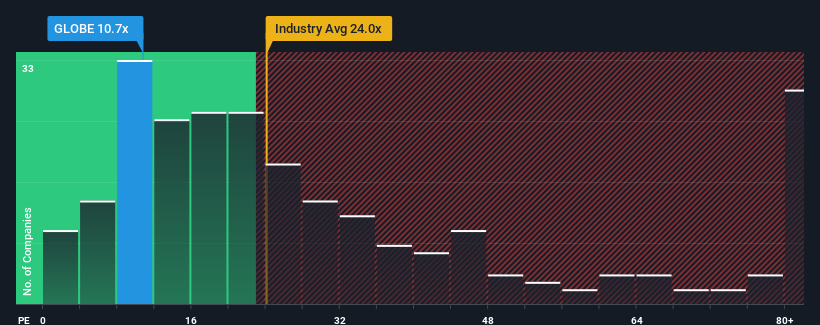
Following the heavy fall in price, Globe Textiles (India) may be sending very bullish signals at the moment with its price-to-earnings (or "P/E") ratio of 10.7x, since almost half of all companies in India have P/E ratios greater than 27x and even P/E's higher than 51x are not unusual. Nonetheless, we'd need to dig a little deeper to determine if there is a rational basis for the highly reduced P/E.
Earnings have risen firmly for Globe Textiles (India) recently, which is pleasing to see. It might be that many expect the respectable earnings performance to degrade substantially, which has repressed the P/E. If that doesn't eventuate, then existing shareholders have reason to be optimistic about the future direction of the share price.
View our latest analysis for Globe Textiles (India)
How Is Globe Textiles (India)'s Growth Trending?
The only time you'd be truly comfortable seeing a P/E as depressed as Globe Textiles (India)'s is when the company's growth is on track to lag the market decidedly.
If we review the last year of earnings growth, the company posted a terrific increase of 15%. Pleasingly, EPS has also lifted 37% in aggregate from three years ago, thanks to the last 12 months of growth. Therefore, it's fair to say the earnings growth recently has been superb for the company.
Comparing that to the market, which is predicted to deliver 26% growth in the next 12 months, the company's momentum is weaker based on recent medium-term annualised earnings results.
With this information, we can see why Globe Textiles (India) is trading at a P/E lower than the market. It seems most investors are expecting to see the recent limited growth rates continue into the future and are only willing to pay a reduced amount for the stock.
The Final Word
Shares in Globe Textiles (India) have plummeted and its P/E is now low enough to touch the ground. Generally, our preference is to limit the use of the price-to-earnings ratio to establishing what the market thinks about the overall health of a company.
As we suspected, our examination of Globe Textiles (India) revealed its three-year earnings trends are contributing to its low P/E, given they look worse than current market expectations. Right now shareholders are accepting the low P/E as they concede future earnings probably won't provide any pleasant surprises. Unless the recent medium-term conditions improve, they will continue to form a barrier for the share price around these levels.
Plus, you should also learn about these 4 warning signs we've spotted with Globe Textiles (India) (including 3 which are significant).
It's important to make sure you look for a great company, not just the first idea you come across. So take a peek at this free list of interesting companies with strong recent earnings growth (and a low P/E).
New: Manage All Your Stock Portfolios in One Place
We've created the ultimate portfolio companion for stock investors, and it's free.
• Connect an unlimited number of Portfolios and see your total in one currency
• Be alerted to new Warning Signs or Risks via email or mobile
• Track the Fair Value of your stocks
Have feedback on this article? Concerned about the content? Get in touch with us directly. Alternatively, email editorial-team (at) simplywallst.com.
This article by Simply Wall St is general in nature. We provide commentary based on historical data and analyst forecasts only using an unbiased methodology and our articles are not intended to be financial advice. It does not constitute a recommendation to buy or sell any stock, and does not take account of your objectives, or your financial situation. We aim to bring you long-term focused analysis driven by fundamental data. Note that our analysis may not factor in the latest price-sensitive company announcements or qualitative material. Simply Wall St has no position in any stocks mentioned.
About NSEI:GLOBE
Globe Textiles (India)
Engages in the manufacture and sale of textile and apparel in India.
Solid track record with mediocre balance sheet.
Similar Companies
Market Insights

Advertisement
Community Narratives
Pinterest will surge as advertising innovations ignite revenue growth
Fair Value US$42.63|26.3% undervalued
BR
Community Contributor
Brambles' Revenue Set to Climb 14% with Profit Margins Following
Fair Value AU$21.90|4.9% overvalued
RO
Community Contributor
Challenging Future for STG as Organic Sales Decline by 8.8%
Fair Value DKK 116.13|26.8% undervalued
KA
Community Contributor