
Advertisement
- India
- /
- Consumer Durables
- /
- NSEI:DIXON
Take Care Before Diving Into The Deep End On Dixon Technologies (India) Limited (NSE:DIXON)
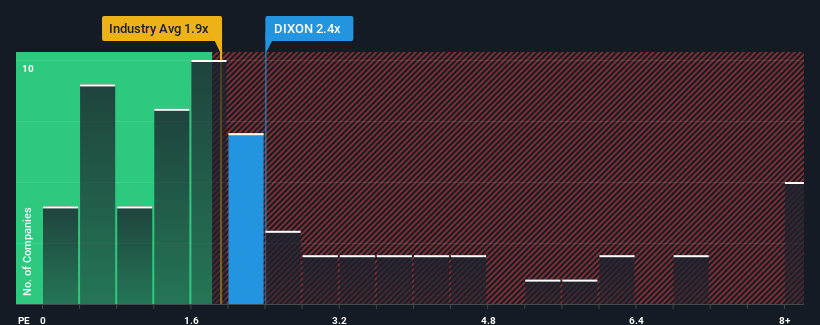
There wouldn't be many who think Dixon Technologies (India) Limited's (NSE:DIXON) price-to-sales (or "P/S") ratio of 2.4x is worth a mention when the median P/S for the Consumer Durables industry in India is similar at about 1.9x. While this might not raise any eyebrows, if the P/S ratio is not justified investors could be missing out on a potential opportunity or ignoring looming disappointment.
Check out our latest analysis for Dixon Technologies (India)
What Does Dixon Technologies (India)'s P/S Mean For Shareholders?
Recent times have been advantageous for Dixon Technologies (India) as its revenues have been rising faster than most other companies. One possibility is that the P/S ratio is moderate because investors think this strong revenue performance might be about to tail off. If you like the company, you'd be hoping this isn't the case so that you could potentially pick up some stock while it's not quite in favour.
Keen to find out how analysts think Dixon Technologies (India)'s future stacks up against the industry? In that case, our free report is a great place to start.Is There Some Revenue Growth Forecasted For Dixon Technologies (India)?
In order to justify its P/S ratio, Dixon Technologies (India) would need to produce growth that's similar to the industry.
If we review the last year of revenue growth, the company posted a terrific increase of 106%. The latest three year period has also seen an excellent 237% overall rise in revenue, aided by its short-term performance. So we can start by confirming that the company has done a great job of growing revenue over that time.
Shifting to the future, estimates from the analysts covering the company suggest revenue should grow by 40% per annum over the next three years. With the industry only predicted to deliver 31% per annum, the company is positioned for a stronger revenue result.
In light of this, it's curious that Dixon Technologies (India)'s P/S sits in line with the majority of other companies. Apparently some shareholders are skeptical of the forecasts and have been accepting lower selling prices.
What Does Dixon Technologies (India)'s P/S Mean For Investors?
Typically, we'd caution against reading too much into price-to-sales ratios when settling on investment decisions, though it can reveal plenty about what other market participants think about the company.
Despite enticing revenue growth figures that outpace the industry, Dixon Technologies (India)'s P/S isn't quite what we'd expect. Perhaps uncertainty in the revenue forecasts are what's keeping the P/S ratio consistent with the rest of the industry. It appears some are indeed anticipating revenue instability, because these conditions should normally provide a boost to the share price.
You always need to take note of risks, for example - Dixon Technologies (India) has 1 warning sign we think you should be aware of.
If companies with solid past earnings growth is up your alley, you may wish to see this free collection of other companies with strong earnings growth and low P/E ratios.
New: Manage All Your Stock Portfolios in One Place
We've created the ultimate portfolio companion for stock investors, and it's free.
• Connect an unlimited number of Portfolios and see your total in one currency
• Be alerted to new Warning Signs or Risks via email or mobile
• Track the Fair Value of your stocks
Have feedback on this article? Concerned about the content? Get in touch with us directly. Alternatively, email editorial-team (at) simplywallst.com.
This article by Simply Wall St is general in nature. We provide commentary based on historical data and analyst forecasts only using an unbiased methodology and our articles are not intended to be financial advice. It does not constitute a recommendation to buy or sell any stock, and does not take account of your objectives, or your financial situation. We aim to bring you long-term focused analysis driven by fundamental data. Note that our analysis may not factor in the latest price-sensitive company announcements or qualitative material. Simply Wall St has no position in any stocks mentioned.
About NSEI:DIXON
Dixon Technologies (India)
Manufactures and sells electronic goods in India and internationally.
Exceptional growth potential with solid track record.
Similar Companies
Market Insights

Advertisement
Community Narratives
A formidable player in AI and enterprise computing.
Fair Value US$210.00|13.6% overvalued
CO
Community Contributor
IREN's Bold Moves in Sustainable Bitcoin Mining & AI Data Centers
Fair Value US$89.00|23.6% undervalued
BL
Community Contributor
Cooling the Champions: The Aussie Tech Behind F1's Victories
Fair Value AU$12.40|37.6% undervalued
TR
Community Contributor