
Advertisement
The Return Trends At Cantabil Retail India (NSE:CANTABIL) Look Promising

What trends should we look for it we want to identify stocks that can multiply in value over the long term? Ideally, a business will show two trends; firstly a growing return on capital employed (ROCE) and secondly, an increasing amount of capital employed. Ultimately, this demonstrates that it's a business that is reinvesting profits at increasing rates of return. So when we looked at Cantabil Retail India (NSE:CANTABIL) and its trend of ROCE, we really liked what we saw.
Return On Capital Employed (ROCE): What is it?
If you haven't worked with ROCE before, it measures the 'return' (pre-tax profit) a company generates from capital employed in its business. Analysts use this formula to calculate it for Cantabil Retail India:
Return on Capital Employed = Earnings Before Interest and Tax (EBIT) ÷ (Total Assets - Current Liabilities)
0.17 = ₹611m ÷ (₹4.6b - ₹1.1b) (Based on the trailing twelve months to December 2021).
So, Cantabil Retail India has an ROCE of 17%. On its own, that's a standard return, however it's much better than the 14% generated by the Luxury industry.
See our latest analysis for Cantabil Retail India
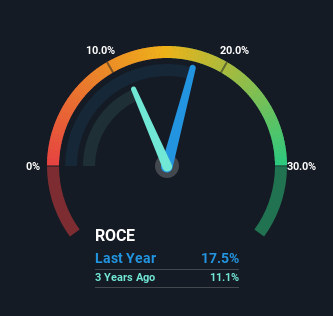
Historical performance is a great place to start when researching a stock so above you can see the gauge for Cantabil Retail India's ROCE against it's prior returns. If you'd like to look at how Cantabil Retail India has performed in the past in other metrics, you can view this free graph of past earnings, revenue and cash flow.
What Can We Tell From Cantabil Retail India's ROCE Trend?
Investors would be pleased with what's happening at Cantabil Retail India. The data shows that returns on capital have increased substantially over the last five years to 17%. Basically the business is earning more per dollar of capital invested and in addition to that, 282% more capital is being employed now too. So we're very much inspired by what we're seeing at Cantabil Retail India thanks to its ability to profitably reinvest capital.
In another part of our analysis, we noticed that the company's ratio of current liabilities to total assets decreased to 24%, which broadly means the business is relying less on its suppliers or short-term creditors to fund its operations. So this improvement in ROCE has come from the business' underlying economics, which is great to see.
What We Can Learn From Cantabil Retail India's ROCE
All in all, it's terrific to see that Cantabil Retail India is reaping the rewards from prior investments and is growing its capital base. Since the stock has returned a staggering 1,183% to shareholders over the last five years, it looks like investors are recognizing these changes. Therefore, we think it would be worth your time to check if these trends are going to continue.
Cantabil Retail India does come with some risks though, we found 3 warning signs in our investment analysis, and 1 of those is a bit concerning...
If you want to search for solid companies with great earnings, check out this free list of companies with good balance sheets and impressive returns on equity.
New: AI Stock Screener & Alerts
Our new AI Stock Screener scans the market every day to uncover opportunities.
• Dividend Powerhouses (3%+ Yield)
• Undervalued Small Caps with Insider Buying
• High growth Tech and AI Companies
Or build your own from over 50 metrics.
Have feedback on this article? Concerned about the content? Get in touch with us directly. Alternatively, email editorial-team (at) simplywallst.com.
This article by Simply Wall St is general in nature. We provide commentary based on historical data and analyst forecasts only using an unbiased methodology and our articles are not intended to be financial advice. It does not constitute a recommendation to buy or sell any stock, and does not take account of your objectives, or your financial situation. We aim to bring you long-term focused analysis driven by fundamental data. Note that our analysis may not factor in the latest price-sensitive company announcements or qualitative material. Simply Wall St has no position in any stocks mentioned.
About NSEI:CANTABIL
Cantabil Retail India
Engages in designing, manufacturing, branding, and retailing apparel and apparel accessories in India.
Excellent balance sheet with proven track record.
Similar Companies
Market Insights


Advertisement
Community Narratives
A case for TSXV:USA to reach USD $5.00 - $9.00 (CAD $7.30–$12.29) by 2029.
Fair Value CA$12.29|91.2% undervalued
AG
Community Contributor
DLocal's Future Growth Fueled by 35% Revenue and Profit Margin Boosts
Fair Value US$195.39|94.1% undervalued
WY
Community Contributor
Historically Cheap, but the Margin of Safety Is Still Thin
Fair Value SEK 232.58|12.7% undervalued
MA
Community Contributor