
Advertisement

If you're not sure where to start when looking for the next multi-bagger, there are a few key trends you should keep an eye out for. Firstly, we'll want to see a proven return on capital employed (ROCE) that is increasing, and secondly, an expanding base of capital employed. Basically this means that a company has profitable initiatives that it can continue to reinvest in, which is a trait of a compounding machine. So on that note, BPL (NSE:BPL) looks quite promising in regards to its trends of return on capital.
Return On Capital Employed (ROCE): What is it?
Just to clarify if you're unsure, ROCE is a metric for evaluating how much pre-tax income (in percentage terms) a company earns on the capital invested in its business. Analysts use this formula to calculate it for BPL:
Return on Capital Employed = Earnings Before Interest and Tax (EBIT) ÷ (Total Assets - Current Liabilities)
0.036 = ₹55m ÷ (₹3.5b - ₹2.0b) (Based on the trailing twelve months to December 2021).
Therefore, BPL has an ROCE of 3.6%. In absolute terms, that's a low return and it also under-performs the Consumer Durables industry average of 13%.
Check out our latest analysis for BPL
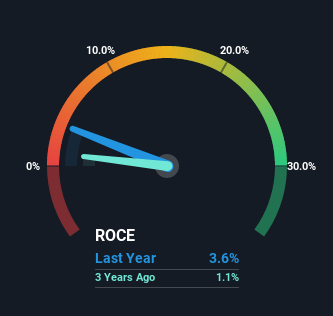
Historical performance is a great place to start when researching a stock so above you can see the gauge for BPL's ROCE against it's prior returns. If you're interested in investigating BPL's past further, check out this free graph of past earnings, revenue and cash flow.
What Does the ROCE Trend For BPL Tell Us?
While the ROCE is still rather low for BPL, we're glad to see it heading in the right direction. The data shows that returns on capital have increased by 235% over the trailing five years. That's a very favorable trend because this means that the company is earning more per dollar of capital that's being employed. Speaking of capital employed, the company is actually utilizing 46% less than it was five years ago, which can be indicative of a business that's improving its efficiency. If this trend continues, the business might be getting more efficient but it's shrinking in terms of total assets.
For the record though, there was a noticeable increase in the company's current liabilities over the period, so we would attribute some of the ROCE growth to that. Essentially the business now has suppliers or short-term creditors funding about 57% of its operations, which isn't ideal. And with current liabilities at those levels, that's pretty high.
The Bottom Line On BPL's ROCE
In the end, BPL has proven it's capital allocation skills are good with those higher returns from less amount of capital. Since the stock has only returned 2.2% to shareholders over the last five years, the promising fundamentals may not be recognized yet by investors. So with that in mind, we think the stock deserves further research.
One more thing: We've identified 3 warning signs with BPL (at least 1 which shouldn't be ignored) , and understanding them would certainly be useful.
While BPL isn't earning the highest return, check out this free list of companies that are earning high returns on equity with solid balance sheets.
Valuation is complex, but we're here to simplify it.
Discover if BPL might be undervalued or overvalued with our detailed analysis, featuring fair value estimates, potential risks, dividends, insider trades, and its financial condition.
Access Free AnalysisHave feedback on this article? Concerned about the content? Get in touch with us directly. Alternatively, email editorial-team (at) simplywallst.com.
This article by Simply Wall St is general in nature. We provide commentary based on historical data and analyst forecasts only using an unbiased methodology and our articles are not intended to be financial advice. It does not constitute a recommendation to buy or sell any stock, and does not take account of your objectives, or your financial situation. We aim to bring you long-term focused analysis driven by fundamental data. Note that our analysis may not factor in the latest price-sensitive company announcements or qualitative material. Simply Wall St has no position in any stocks mentioned.
About NSEI:BPL
BPL
Manufactures and sells consumer electronic products primarily in India.
Slightly overvalued with questionable track record.
Similar Companies
Market Insights

Advertisement
Community Narratives
Scaling up in building materials with smart M&A and growing profitability
Fair Value US$2.77|24.5% undervalued
CM
Community Contributor
Hims: The Platform Powering Personalised Healthcare
Fair Value US$114.01|45.3% undervalued
BL
Community Contributor
Undervalued lottery company with strong fundamentals
Fair Value AU$15.00|33.9% undervalued
RO
Community Contributor
Proximus, transferring money from the impatient to the patient investor
Fair Value €16.62|57.0% undervalued
AX
Community Contributor