
Advertisement
Revenues Tell The Story For Bhartiya International Ltd. (NSE:BIL) As Its Stock Soars 32%

Bhartiya International Ltd. (NSE:BIL) shareholders have had their patience rewarded with a 32% share price jump in the last month. The last month tops off a massive increase of 133% in the last year.
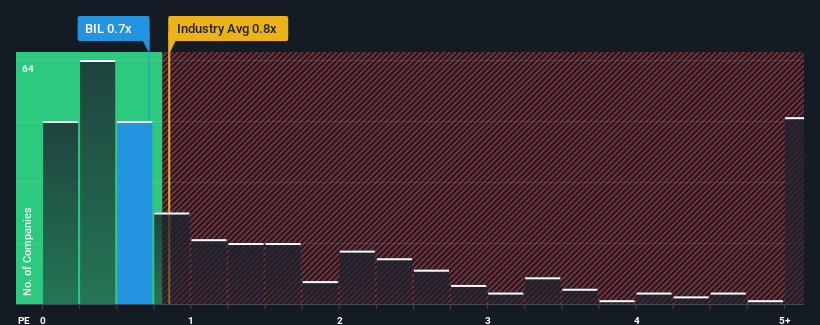
In spite of the firm bounce in price, there still wouldn't be many who think Bhartiya International's price-to-sales (or "P/S") ratio of 0.7x is worth a mention when the median P/S in India's Luxury industry is similar at about 0.8x. While this might not raise any eyebrows, if the P/S ratio is not justified investors could be missing out on a potential opportunity or ignoring looming disappointment.
View our latest analysis for Bhartiya International
What Does Bhartiya International's Recent Performance Look Like?
For instance, Bhartiya International's receding revenue in recent times would have to be some food for thought. One possibility is that the P/S is moderate because investors think the company might still do enough to be in line with the broader industry in the near future. If you like the company, you'd at least be hoping this is the case so that you could potentially pick up some stock while it's not quite in favour.
Although there are no analyst estimates available for Bhartiya International, take a look at this free data-rich visualisation to see how the company stacks up on earnings, revenue and cash flow.How Is Bhartiya International's Revenue Growth Trending?
Bhartiya International's P/S ratio would be typical for a company that's only expected to deliver moderate growth, and importantly, perform in line with the industry.
In reviewing the last year of financials, we were disheartened to see the company's revenues fell to the tune of 7.9%. However, a few very strong years before that means that it was still able to grow revenue by an impressive 40% in total over the last three years. Although it's been a bumpy ride, it's still fair to say the revenue growth recently has been more than adequate for the company.
Comparing that to the industry, which is predicted to deliver 12% growth in the next 12 months, the company's momentum is pretty similar based on recent medium-term annualised revenue results.
With this information, we can see why Bhartiya International is trading at a fairly similar P/S to the industry. It seems most investors are expecting to see average growth rates continue into the future and are only willing to pay a moderate amount for the stock.
The Final Word
Bhartiya International appears to be back in favour with a solid price jump bringing its P/S back in line with other companies in the industry Typically, we'd caution against reading too much into price-to-sales ratios when settling on investment decisions, though it can reveal plenty about what other market participants think about the company.
It appears to us that Bhartiya International maintains its moderate P/S off the back of its recent three-year growth being in line with the wider industry forecast. Currently, with a past revenue trend that aligns closely wit the industry outlook, shareholders are confident the company's future revenue outlook won't contain any major surprises. Unless the recent medium-term conditions change, they will continue to support the share price at these levels.
Plus, you should also learn about these 3 warning signs we've spotted with Bhartiya International (including 2 which are a bit concerning).
Of course, profitable companies with a history of great earnings growth are generally safer bets. So you may wish to see this free collection of other companies that have reasonable P/E ratios and have grown earnings strongly.
Valuation is complex, but we're here to simplify it.
Discover if Bhartiya International might be undervalued or overvalued with our detailed analysis, featuring fair value estimates, potential risks, dividends, insider trades, and its financial condition.
Access Free AnalysisHave feedback on this article? Concerned about the content? Get in touch with us directly. Alternatively, email editorial-team (at) simplywallst.com.
This article by Simply Wall St is general in nature. We provide commentary based on historical data and analyst forecasts only using an unbiased methodology and our articles are not intended to be financial advice. It does not constitute a recommendation to buy or sell any stock, and does not take account of your objectives, or your financial situation. We aim to bring you long-term focused analysis driven by fundamental data. Note that our analysis may not factor in the latest price-sensitive company announcements or qualitative material. Simply Wall St has no position in any stocks mentioned.
About NSEI:BIL
Bhartiya International
Manufactures, trades in, and sells leather and textile products in India.
Questionable track record with imperfect balance sheet.
Similar Companies
Market Insights

Advertisement
Community Narratives
Scaling up in building materials with smart M&A and growing profitability
Fair Value US$2.77|28.9% undervalued
CM
Community Contributor
Hims: The Platform Powering Personalised Healthcare
Fair Value US$114.01|46.3% undervalued
BL
Community Contributor
Undervalued lottery company with strong fundamentals
Fair Value AU$15.00|33.9% undervalued
RO
Community Contributor
Proximus, transferring money from the impatient to the patient investor
Fair Value €16.62|56.1% undervalued
AX
Community Contributor