
Advertisement
- India
- /
- Professional Services
- /
- NSEI:SPECTSTM
The Market Lifts Spectrum Talent Management Limited (NSE:SPECTSTM) Shares 28% But It Can Do More

Despite an already strong run, Spectrum Talent Management Limited (NSE:SPECTSTM) shares have been powering on, with a gain of 28% in the last thirty days. Not all shareholders will be feeling jubilant, since the share price is still down a very disappointing 19% in the last twelve months.
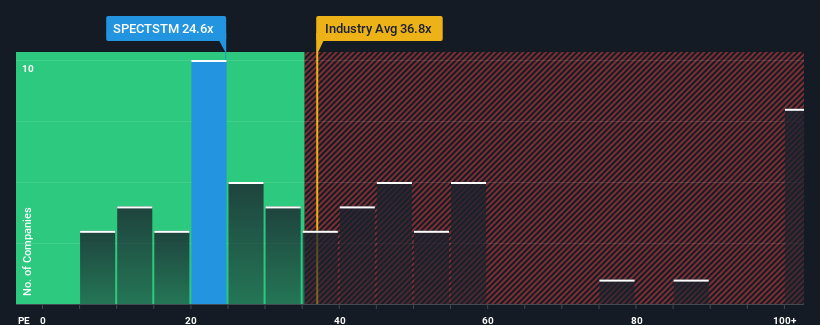
In spite of the firm bounce in price, Spectrum Talent Management may still be sending bullish signals at the moment with its price-to-earnings (or "P/E") ratio of 24.6x, since almost half of all companies in India have P/E ratios greater than 35x and even P/E's higher than 64x are not unusual. However, the P/E might be low for a reason and it requires further investigation to determine if it's justified.
For instance, Spectrum Talent Management's receding earnings in recent times would have to be some food for thought. One possibility is that the P/E is low because investors think the company won't do enough to avoid underperforming the broader market in the near future. If you like the company, you'd be hoping this isn't the case so that you could potentially pick up some stock while it's out of favour.
Check out our latest analysis for Spectrum Talent Management
Is There Any Growth For Spectrum Talent Management?
In order to justify its P/E ratio, Spectrum Talent Management would need to produce sluggish growth that's trailing the market.
If we review the last year of earnings, dishearteningly the company's profits fell to the tune of 67%. However, a few very strong years before that means that it was still able to grow EPS by an impressive 95% in total over the last three years. Although it's been a bumpy ride, it's still fair to say the earnings growth recently has been more than adequate for the company.
Weighing that recent medium-term earnings trajectory against the broader market's one-year forecast for expansion of 25% shows it's about the same on an annualised basis.
In light of this, it's peculiar that Spectrum Talent Management's P/E sits below the majority of other companies. Apparently some shareholders are more bearish than recent times would indicate and have been accepting lower selling prices.
What We Can Learn From Spectrum Talent Management's P/E?
Despite Spectrum Talent Management's shares building up a head of steam, its P/E still lags most other companies. Using the price-to-earnings ratio alone to determine if you should sell your stock isn't sensible, however it can be a practical guide to the company's future prospects.
We've established that Spectrum Talent Management currently trades on a lower than expected P/E since its recent three-year growth is in line with the wider market forecast. When we see average earnings with market-like growth, we assume potential risks are what might be placing pressure on the P/E ratio. It appears some are indeed anticipating earnings instability, because the persistence of these recent medium-term conditions should normally provide more support to the share price.
It's always necessary to consider the ever-present spectre of investment risk. We've identified 4 warning signs with Spectrum Talent Management (at least 2 which make us uncomfortable), and understanding these should be part of your investment process.
Of course, you might also be able to find a better stock than Spectrum Talent Management. So you may wish to see this free collection of other companies that have reasonable P/E ratios and have grown earnings strongly.
New: Manage All Your Stock Portfolios in One Place
We've created the ultimate portfolio companion for stock investors, and it's free.
• Connect an unlimited number of Portfolios and see your total in one currency
• Be alerted to new Warning Signs or Risks via email or mobile
• Track the Fair Value of your stocks
Have feedback on this article? Concerned about the content? Get in touch with us directly. Alternatively, email editorial-team (at) simplywallst.com.
This article by Simply Wall St is general in nature. We provide commentary based on historical data and analyst forecasts only using an unbiased methodology and our articles are not intended to be financial advice. It does not constitute a recommendation to buy or sell any stock, and does not take account of your objectives, or your financial situation. We aim to bring you long-term focused analysis driven by fundamental data. Note that our analysis may not factor in the latest price-sensitive company announcements or qualitative material. Simply Wall St has no position in any stocks mentioned.
About NSEI:SPECTSTM
Spectrum Talent Management
Provides manpower solutions in India and internationally.
Adequate balance sheet slight.
Similar Companies
Market Insights

Advertisement
Community Narratives
Pinterest will surge as advertising innovations ignite revenue growth
Fair Value US$42.63|26.3% undervalued
BR
Community Contributor
Brambles' Revenue Set to Climb 14% with Profit Margins Following
Fair Value AU$21.90|4.8% overvalued
RO
Community Contributor
Challenging Future for STG as Organic Sales Decline by 8.8%
Fair Value DKK 116.13|26.8% undervalued
KA
Community Contributor