- India
- /
- Commercial Services
- /
- NSEI:SIS
These 4 Measures Indicate That SIS (NSE:SIS) Is Using Debt Reasonably Well


David Iben put it well when he said, 'Volatility is not a risk we care about. What we care about is avoiding the permanent loss of capital.' When we think about how risky a company is, we always like to look at its use of debt, since debt overload can lead to ruin. As with many other companies SIS Limited (NSE:SIS) makes use of debt. But should shareholders be worried about its use of debt?
What Risk Does Debt Bring?
Debt assists a business until the business has trouble paying it off, either with new capital or with free cash flow. Part and parcel of capitalism is the process of 'creative destruction' where failed businesses are mercilessly liquidated by their bankers. However, a more common (but still painful) scenario is that it has to raise new equity capital at a low price, thus permanently diluting shareholders. Having said that, the most common situation is where a company manages its debt reasonably well - and to its own advantage. When we think about a company's use of debt, we first look at cash and debt together.
Check out our latest analysis for SIS
What Is SIS's Net Debt?
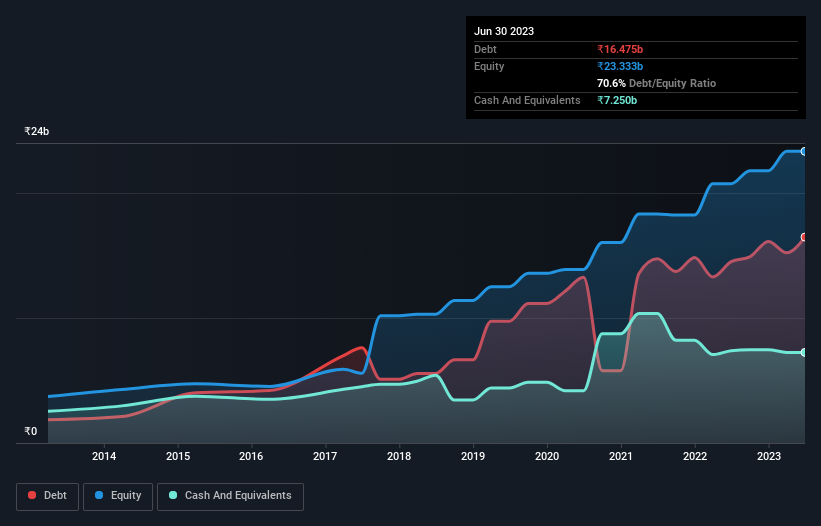
You can click the graphic below for the historical numbers, but it shows that as of March 2023 SIS had ₹16.5b of debt, an increase on ₹14.5b, over one year. However, because it has a cash reserve of ₹7.25b, its net debt is less, at about ₹9.22b.
How Healthy Is SIS' Balance Sheet?
We can see from the most recent balance sheet that SIS had liabilities of ₹22.6b falling due within a year, and liabilities of ₹11.2b due beyond that. On the other hand, it had cash of ₹7.25b and ₹23.0b worth of receivables due within a year. So its liabilities total ₹3.55b more than the combination of its cash and short-term receivables.
Given SIS has a market capitalization of ₹63.6b, it's hard to believe these liabilities pose much threat. Having said that, it's clear that we should continue to monitor its balance sheet, lest it change for the worse.
We use two main ratios to inform us about debt levels relative to earnings. The first is net debt divided by earnings before interest, tax, depreciation, and amortization (EBITDA), while the second is how many times its earnings before interest and tax (EBIT) covers its interest expense (or its interest cover, for short). The advantage of this approach is that we take into account both the absolute quantum of debt (with net debt to EBITDA) and the actual interest expenses associated with that debt (with its interest cover ratio).
SIS's net debt is sitting at a very reasonable 2.0 times its EBITDA, while its EBIT covered its interest expense just 3.9 times last year. While these numbers do not alarm us, it's worth noting that the cost of the company's debt is having a real impact. Sadly, SIS's EBIT actually dropped 4.3% in the last year. If that earnings trend continues then its debt load will grow heavy like the heart of a polar bear watching its sole cub. When analysing debt levels, the balance sheet is the obvious place to start. But it is future earnings, more than anything, that will determine SIS's ability to maintain a healthy balance sheet going forward. So if you're focused on the future you can check out this free report showing analyst profit forecasts.
But our final consideration is also important, because a company cannot pay debt with paper profits; it needs cold hard cash. So we clearly need to look at whether that EBIT is leading to corresponding free cash flow. In the last three years, SIS's free cash flow amounted to 46% of its EBIT, less than we'd expect. That weak cash conversion makes it more difficult to handle indebtedness.
Our View
SIS's interest cover was a real negative on this analysis, as was its EBIT growth rate. On the other hand, we found comfort in its relatively strong level of total liabilities. Looking at all this data makes us feel a little cautious about SIS's debt levels. While we appreciate debt can enhance returns on equity, we'd suggest that shareholders keep close watch on its debt levels, lest they increase. Above most other metrics, we think its important to track how fast earnings per share is growing, if at all. If you've also come to that realization, you're in luck, because today you can view this interactive graph of SIS's earnings per share history for free.
If, after all that, you're more interested in a fast growing company with a rock-solid balance sheet, then check out our list of net cash growth stocks without delay.
New: Manage All Your Stock Portfolios in One Place
We've created the ultimate portfolio companion for stock investors, and it's free.
• Connect an unlimited number of Portfolios and see your total in one currency
• Be alerted to new Warning Signs or Risks via email or mobile
• Track the Fair Value of your stocks
Have feedback on this article? Concerned about the content? Get in touch with us directly. Alternatively, email editorial-team (at) simplywallst.com.
This article by Simply Wall St is general in nature. We provide commentary based on historical data and analyst forecasts only using an unbiased methodology and our articles are not intended to be financial advice. It does not constitute a recommendation to buy or sell any stock, and does not take account of your objectives, or your financial situation. We aim to bring you long-term focused analysis driven by fundamental data. Note that our analysis may not factor in the latest price-sensitive company announcements or qualitative material. Simply Wall St has no position in any stocks mentioned.
About NSEI:SIS
SIS
Provides security and related services in India, Australia, Singapore, and New Zealand.
Excellent balance sheet and good value.
Market Insights

Community Narratives


