
Advertisement

The external fund manager backed by Berkshire Hathaway's Charlie Munger, Li Lu, makes no bones about it when he says 'The biggest investment risk is not the volatility of prices, but whether you will suffer a permanent loss of capital.' It's only natural to consider a company's balance sheet when you examine how risky it is, since debt is often involved when a business collapses. Importantly, SIS Limited (NSE:SIS) does carry debt. But is this debt a concern to shareholders?
When Is Debt A Problem?
Debt assists a business until the business has trouble paying it off, either with new capital or with free cash flow. Ultimately, if the company can't fulfill its legal obligations to repay debt, shareholders could walk away with nothing. However, a more frequent (but still costly) occurrence is where a company must issue shares at bargain-basement prices, permanently diluting shareholders, just to shore up its balance sheet. Of course, plenty of companies use debt to fund growth, without any negative consequences. The first thing to do when considering how much debt a business uses is to look at its cash and debt together.
View our latest analysis for SIS
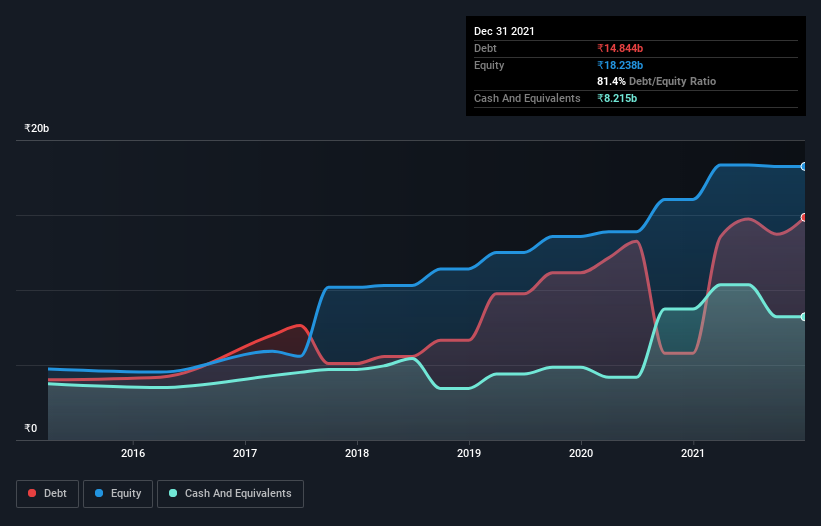
What Is SIS's Net Debt?
As you can see below, at the end of September 2021, SIS had ₹14.8b of debt, up from ₹5.79b a year ago. Click the image for more detail. On the flip side, it has ₹8.22b in cash leading to net debt of about ₹6.63b.
How Healthy Is SIS' Balance Sheet?
The latest balance sheet data shows that SIS had liabilities of ₹25.0b due within a year, and liabilities of ₹5.30b falling due after that. Offsetting this, it had ₹8.22b in cash and ₹11.9b in receivables that were due within 12 months. So it has liabilities totalling ₹10.1b more than its cash and near-term receivables, combined.
Of course, SIS has a market capitalization of ₹80.6b, so these liabilities are probably manageable. But there are sufficient liabilities that we would certainly recommend shareholders continue to monitor the balance sheet, going forward.
In order to size up a company's debt relative to its earnings, we calculate its net debt divided by its earnings before interest, tax, depreciation, and amortization (EBITDA) and its earnings before interest and tax (EBIT) divided by its interest expense (its interest cover). The advantage of this approach is that we take into account both the absolute quantum of debt (with net debt to EBITDA) and the actual interest expenses associated with that debt (with its interest cover ratio).
SIS has a low debt to EBITDA ratio of only 1.5. But the really cool thing is that it actually managed to receive more interest than it paid, over the last year. So it's fair to say it can handle debt like a hotshot teppanyaki chef handles cooking. But the other side of the story is that SIS saw its EBIT decline by 7.4% over the last year. If earnings continue to decline at that rate the company may have increasing difficulty managing its debt load. When analysing debt levels, the balance sheet is the obvious place to start. But ultimately the future profitability of the business will decide if SIS can strengthen its balance sheet over time. So if you're focused on the future you can check out this free report showing analyst profit forecasts.
But our final consideration is also important, because a company cannot pay debt with paper profits; it needs cold hard cash. So it's worth checking how much of that EBIT is backed by free cash flow. During the last three years, SIS generated free cash flow amounting to a very robust 86% of its EBIT, more than we'd expect. That positions it well to pay down debt if desirable to do so.
Our View
Happily, SIS's impressive interest cover implies it has the upper hand on its debt. But, on a more sombre note, we are a little concerned by its EBIT growth rate. When we consider the range of factors above, it looks like SIS is pretty sensible with its use of debt. That means they are taking on a bit more risk, in the hope of boosting shareholder returns. There's no doubt that we learn most about debt from the balance sheet. But ultimately, every company can contain risks that exist outside of the balance sheet. Be aware that SIS is showing 1 warning sign in our investment analysis , you should know about...
If, after all that, you're more interested in a fast growing company with a rock-solid balance sheet, then check out our list of net cash growth stocks without delay.
New: Manage All Your Stock Portfolios in One Place
We've created the ultimate portfolio companion for stock investors, and it's free.
• Connect an unlimited number of Portfolios and see your total in one currency
• Be alerted to new Warning Signs or Risks via email or mobile
• Track the Fair Value of your stocks
Have feedback on this article? Concerned about the content? Get in touch with us directly. Alternatively, email editorial-team (at) simplywallst.com.
This article by Simply Wall St is general in nature. We provide commentary based on historical data and analyst forecasts only using an unbiased methodology and our articles are not intended to be financial advice. It does not constitute a recommendation to buy or sell any stock, and does not take account of your objectives, or your financial situation. We aim to bring you long-term focused analysis driven by fundamental data. Note that our analysis may not factor in the latest price-sensitive company announcements or qualitative material. Simply Wall St has no position in any stocks mentioned.
About NSEI:SIS
SIS
Provides security and related services in India, Australia, Singapore, and New Zealand.
Excellent balance sheet and good value.
Market Insights

Advertisement
Community Narratives

Apple: A Dying Star with an Overpriced Valuation
Fair Value US$177.34|19.1% overvalued
IN
Community Contributor
Avino a case for USD$20 per share within 5 years (assuming $3,500 gold, $100 silver and $4 copper).
Fair Value CA$26.79|86.0% undervalued
AG
Community Contributor
Riding the Defense Boom RENK Sees Revenue Climb at 15% CAGR by FY 2029
Fair Value €69.87|14.3% undervalued
CH
Community Contributor