
Advertisement
Are Yuken India Limited's (NSE:YUKEN) Mixed Financials The Reason For Its Gloomy Performance on The Stock Market?

Yuken India (NSE:YUKEN) has had a rough three months with its share price down 32%. We, however decided to study the company's financials to determine if they have got anything to do with the price decline. Stock prices are usually driven by a company’s financial performance over the long term, and therefore we decided to pay more attention to the company's financial performance. In this article, we decided to focus on Yuken India's ROE.
Return on equity or ROE is an important factor to be considered by a shareholder because it tells them how effectively their capital is being reinvested. Simply put, it is used to assess the profitability of a company in relation to its equity capital.
Check out our latest analysis for Yuken India
How Is ROE Calculated?
The formula for ROE is:
Return on Equity = Net Profit (from continuing operations) ÷ Shareholders' Equity
So, based on the above formula, the ROE for Yuken India is:
8.5% = ₹247m ÷ ₹2.9b (Based on the trailing twelve months to December 2024).
The 'return' is the profit over the last twelve months. One way to conceptualize this is that for each ₹1 of shareholders' capital it has, the company made ₹0.09 in profit.
What Has ROE Got To Do With Earnings Growth?
Thus far, we have learned that ROE measures how efficiently a company is generating its profits. Based on how much of its profits the company chooses to reinvest or "retain", we are then able to evaluate a company's future ability to generate profits. Assuming all else is equal, companies that have both a higher return on equity and higher profit retention are usually the ones that have a higher growth rate when compared to companies that don't have the same features.
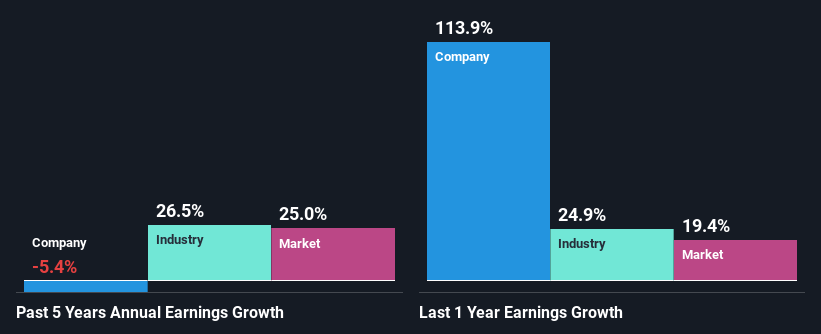
A Side By Side comparison of Yuken India's Earnings Growth And 8.5% ROE
As you can see, Yuken India's ROE looks pretty weak. Not just that, even compared to the industry average of 15%, the company's ROE is entirely unremarkable. Therefore, it might not be wrong to say that the five year net income decline of 5.4% seen by Yuken India was possibly a result of it having a lower ROE. We reckon that there could also be other factors at play here. For instance, the company has a very high payout ratio, or is faced with competitive pressures.
However, when we compared Yuken India's growth with the industry we found that while the company's earnings have been shrinking, the industry has seen an earnings growth of 26% in the same period. This is quite worrisome.
Earnings growth is a huge factor in stock valuation. It’s important for an investor to know whether the market has priced in the company's expected earnings growth (or decline). This then helps them determine if the stock is placed for a bright or bleak future. If you're wondering about Yuken India's's valuation, check out this gauge of its price-to-earnings ratio, as compared to its industry.
Is Yuken India Efficiently Re-investing Its Profits?
When we piece together Yuken India's low three-year median payout ratio of 10% (where it is retaining 90% of its profits), calculated for the last three-year period, we are puzzled by the lack of growth. This typically shouldn't be the case when a company is retaining most of its earnings. So there could be some other explanations in that regard. For example, the company's business may be deteriorating.
Moreover, Yuken India has been paying dividends for at least ten years or more suggesting that management must have perceived that the shareholders prefer dividends over earnings growth.
Conclusion
Overall, we have mixed feelings about Yuken India. Even though it appears to be retaining most of its profits, given the low ROE, investors may not be benefitting from all that reinvestment after all. The low earnings growth suggests our theory correct. Wrapping up, we would proceed with caution with this company and one way of doing that would be to look at the risk profile of the business. You can see the 1 risk we have identified for Yuken India by visiting our risks dashboard for free on our platform here.
New: Manage All Your Stock Portfolios in One Place
We've created the ultimate portfolio companion for stock investors, and it's free.
• Connect an unlimited number of Portfolios and see your total in one currency
• Be alerted to new Warning Signs or Risks via email or mobile
• Track the Fair Value of your stocks
Have feedback on this article? Concerned about the content? Get in touch with us directly. Alternatively, email editorial-team (at) simplywallst.com.
This article by Simply Wall St is general in nature. We provide commentary based on historical data and analyst forecasts only using an unbiased methodology and our articles are not intended to be financial advice. It does not constitute a recommendation to buy or sell any stock, and does not take account of your objectives, or your financial situation. We aim to bring you long-term focused analysis driven by fundamental data. Note that our analysis may not factor in the latest price-sensitive company announcements or qualitative material. Simply Wall St has no position in any stocks mentioned.
About NSEI:YUKEN
Yuken India
Engages in the manufacture and sale of oil hydraulic equipment primarily in India.
Excellent balance sheet with proven track record.
Market Insights

Advertisement
Community Narratives

Apple: A Dying Star with an Overpriced Valuation
Fair Value US$177.34|19.1% overvalued
IN
Community Contributor
Avino a case for USD$20 per share within 5 years (assuming $3,500 gold, $100 silver and $4 copper).
Fair Value CA$26.79|86.0% undervalued
AG
Community Contributor
Riding the Defense Boom RENK Sees Revenue Climb at 15% CAGR by FY 2029
Fair Value €69.87|14.3% undervalued
CH
Community Contributor