
Advertisement
- India
- /
- Trade Distributors
- /
- NSEI:SRD
Shankar Lal Rampal Dye-Chem Limited's (NSE:SRD) Shares Climb 31% But Its Business Is Yet to Catch Up
Despite an already strong run, Shankar Lal Rampal Dye-Chem Limited (NSE:SRD) shares have been powering on, with a gain of 31% in the last thirty days. Longer-term shareholders would be thankful for the recovery in the share price since it's now virtually flat for the year after the recent bounce.
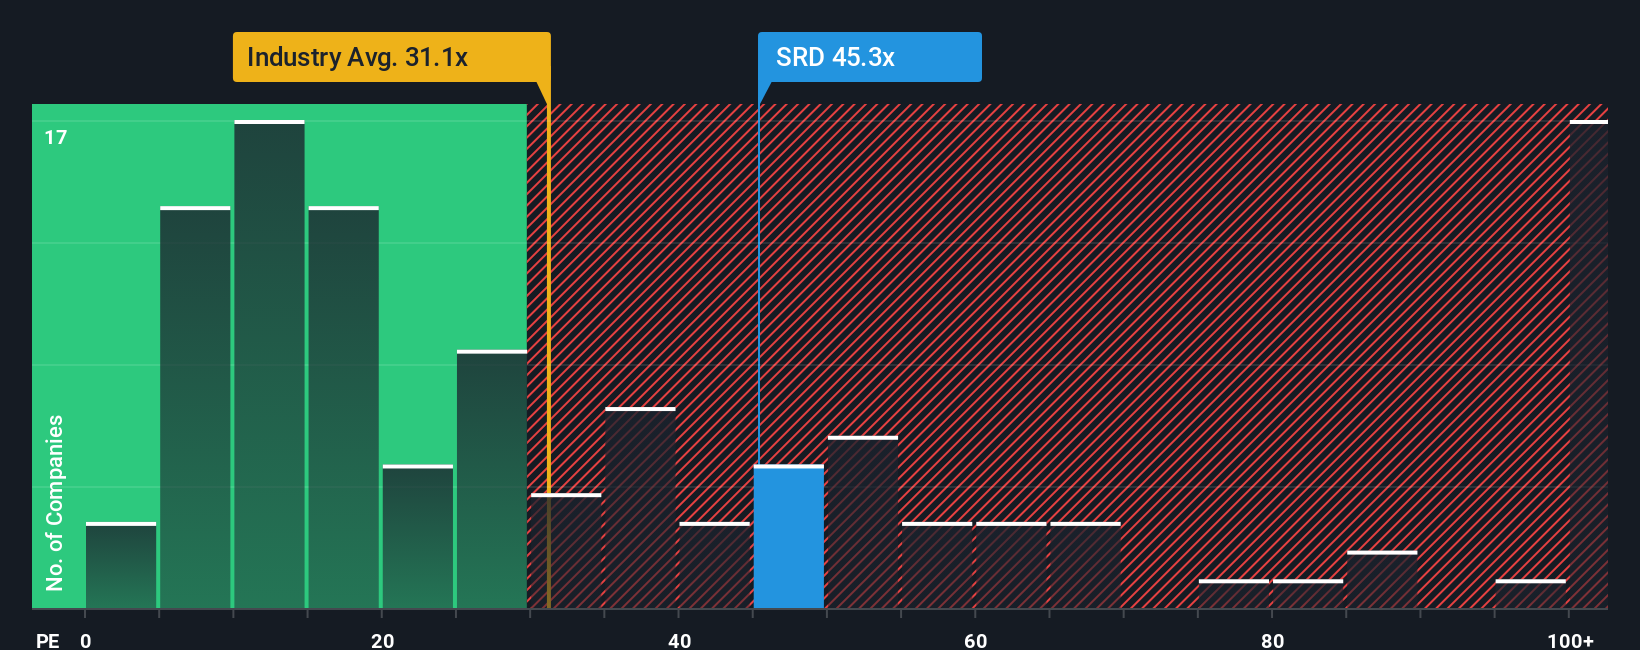
Following the firm bounce in price, given close to half the companies in India have price-to-earnings ratios (or "P/E's") below 29x, you may consider Shankar Lal Rampal Dye-Chem as a stock to avoid entirely with its 45.3x P/E ratio. Nonetheless, we'd need to dig a little deeper to determine if there is a rational basis for the highly elevated P/E.
Recent times have been quite advantageous for Shankar Lal Rampal Dye-Chem as its earnings have been rising very briskly. The P/E is probably high because investors think this strong earnings growth will be enough to outperform the broader market in the near future. You'd really hope so, otherwise you're paying a pretty hefty price for no particular reason.
Check out our latest analysis for Shankar Lal Rampal Dye-Chem
What Are Growth Metrics Telling Us About The High P/E?
The only time you'd be truly comfortable seeing a P/E as steep as Shankar Lal Rampal Dye-Chem's is when the company's growth is on track to outshine the market decidedly.
Taking a look back first, we see that the company grew earnings per share by an impressive 75% last year. However, this wasn't enough as the latest three year period has seen a very unpleasant 58% drop in EPS in aggregate. So unfortunately, we have to acknowledge that the company has not done a great job of growing earnings over that time.
Comparing that to the market, which is predicted to deliver 23% growth in the next 12 months, the company's downward momentum based on recent medium-term earnings results is a sobering picture.
With this information, we find it concerning that Shankar Lal Rampal Dye-Chem is trading at a P/E higher than the market. Apparently many investors in the company are way more bullish than recent times would indicate and aren't willing to let go of their stock at any price. Only the boldest would assume these prices are sustainable as a continuation of recent earnings trends is likely to weigh heavily on the share price eventually.
The Bottom Line On Shankar Lal Rampal Dye-Chem's P/E
Shankar Lal Rampal Dye-Chem's P/E is flying high just like its stock has during the last month. Generally, our preference is to limit the use of the price-to-earnings ratio to establishing what the market thinks about the overall health of a company.
Our examination of Shankar Lal Rampal Dye-Chem revealed its shrinking earnings over the medium-term aren't impacting its high P/E anywhere near as much as we would have predicted, given the market is set to grow. Right now we are increasingly uncomfortable with the high P/E as this earnings performance is highly unlikely to support such positive sentiment for long. Unless the recent medium-term conditions improve markedly, it's very challenging to accept these prices as being reasonable.
There are also other vital risk factors to consider and we've discovered 2 warning signs for Shankar Lal Rampal Dye-Chem (1 doesn't sit too well with us!) that you should be aware of before investing here.
Of course, you might also be able to find a better stock than Shankar Lal Rampal Dye-Chem. So you may wish to see this free collection of other companies that have reasonable P/E ratios and have grown earnings strongly.
New: Manage All Your Stock Portfolios in One Place
We've created the ultimate portfolio companion for stock investors, and it's free.
• Connect an unlimited number of Portfolios and see your total in one currency
• Be alerted to new Warning Signs or Risks via email or mobile
• Track the Fair Value of your stocks
Have feedback on this article? Concerned about the content? Get in touch with us directly. Alternatively, email editorial-team (at) simplywallst.com.
This article by Simply Wall St is general in nature. We provide commentary based on historical data and analyst forecasts only using an unbiased methodology and our articles are not intended to be financial advice. It does not constitute a recommendation to buy or sell any stock, and does not take account of your objectives, or your financial situation. We aim to bring you long-term focused analysis driven by fundamental data. Note that our analysis may not factor in the latest price-sensitive company announcements or qualitative material. Simply Wall St has no position in any stocks mentioned.
About NSEI:SRD
Shankar Lal Rampal Dye-Chem
Engages in trading of dyes, chemicals, and allied products.
Excellent balance sheet with proven track record.
Similar Companies
Market Insights


Advertisement
Community Narratives
America Wants Homegrown Drones — Draganfly Is Ready to Deliver
Fair Value US$9.21|27.4% undervalued
JO
Community Contributor
Cheesecake Factory offers an enticing opportunity for long-term growth by leveraging new concepts
Fair Value US$73.83|25.8% undervalued
ZW
Community Contributor
Coca-Cola’s Intrinsic Value Set to Rise with Fed Rate Cut
Fair Value US$67.50|2.7% undervalued
AL
Community Contributor
Fully Permitted Gold Mine with 50 Baggers Potential 
Fair Value CA$41.00|98.0% undervalued
RO
Community Contributor