Synergy Green Industries Limited's (NSE:SGIL) Shares Leap 26% Yet They're Still Not Telling The Full Story


Despite an already strong run, Synergy Green Industries Limited (NSE:SGIL) shares have been powering on, with a gain of 26% in the last thirty days. The annual gain comes to 209% following the latest surge, making investors sit up and take notice.
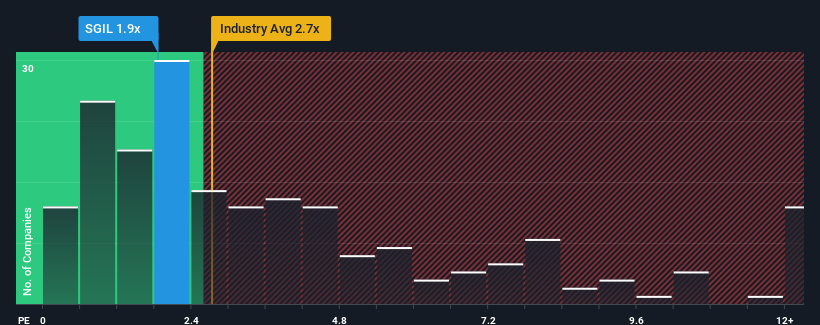
In spite of the firm bounce in price, Synergy Green Industries' price-to-sales (or "P/S") ratio of 1.9x might still make it look like a buy right now compared to the Machinery industry in India, where around half of the companies have P/S ratios above 2.7x and even P/S above 6x are quite common. However, the P/S might be low for a reason and it requires further investigation to determine if it's justified.
See our latest analysis for Synergy Green Industries
How Has Synergy Green Industries Performed Recently?
Synergy Green Industries has been doing a decent job lately as it's been growing revenue at a reasonable pace. Perhaps the market believes the recent revenue performance might fall short of industry figures in the near future, leading to a reduced P/S. If that doesn't eventuate, then existing shareholders may have reason to be optimistic about the future direction of the share price.
Although there are no analyst estimates available for Synergy Green Industries, take a look at this free data-rich visualisation to see how the company stacks up on earnings, revenue and cash flow.How Is Synergy Green Industries' Revenue Growth Trending?
Synergy Green Industries' P/S ratio would be typical for a company that's only expected to deliver limited growth, and importantly, perform worse than the industry.
Taking a look back first, we see that the company managed to grow revenues by a handy 6.7% last year. The latest three year period has also seen an excellent 82% overall rise in revenue, aided somewhat by its short-term performance. Accordingly, shareholders would have definitely welcomed those medium-term rates of revenue growth.
Comparing that recent medium-term revenue trajectory with the industry's one-year growth forecast of 13% shows it's noticeably more attractive.
In light of this, it's peculiar that Synergy Green Industries' P/S sits below the majority of other companies. Apparently some shareholders believe the recent performance has exceeded its limits and have been accepting significantly lower selling prices.
The Key Takeaway
The latest share price surge wasn't enough to lift Synergy Green Industries' P/S close to the industry median. Generally, our preference is to limit the use of the price-to-sales ratio to establishing what the market thinks about the overall health of a company.
Our examination of Synergy Green Industries revealed its three-year revenue trends aren't boosting its P/S anywhere near as much as we would have predicted, given they look better than current industry expectations. Potential investors that are sceptical over continued revenue performance may be preventing the P/S ratio from matching previous strong performance. At least price risks look to be very low if recent medium-term revenue trends continue, but investors seem to think future revenue could see a lot of volatility.
Don't forget that there may be other risks. For instance, we've identified 3 warning signs for Synergy Green Industries (2 are a bit unpleasant) you should be aware of.
If strong companies turning a profit tickle your fancy, then you'll want to check out this free list of interesting companies that trade on a low P/E (but have proven they can grow earnings).
New: Manage All Your Stock Portfolios in One Place
We've created the ultimate portfolio companion for stock investors, and it's free.
• Connect an unlimited number of Portfolios and see your total in one currency
• Be alerted to new Warning Signs or Risks via email or mobile
• Track the Fair Value of your stocks
Have feedback on this article? Concerned about the content? Get in touch with us directly. Alternatively, email editorial-team (at) simplywallst.com.
This article by Simply Wall St is general in nature. We provide commentary based on historical data and analyst forecasts only using an unbiased methodology and our articles are not intended to be financial advice. It does not constitute a recommendation to buy or sell any stock, and does not take account of your objectives, or your financial situation. We aim to bring you long-term focused analysis driven by fundamental data. Note that our analysis may not factor in the latest price-sensitive company announcements or qualitative material. Simply Wall St has no position in any stocks mentioned.
About NSEI:SGIL
Synergy Green Industries
Manufactures and sells wind turbine casting and other large precision castings in India.
Acceptable track record low.
Similar Companies
Market Insights

Community Narratives


